Basic Review of Wave Physics (No Math)
Published:
This is an excerpt from a set of lesson plans I wrote a while ago for a group of (very keen) middle school science students. I am attending a cardiac ultrasound workshop tomorrow, so I dug this out of my dusty pre-medical school Obsidian vault for review. Link to associated Google Slides.
Table of Contents
- The Physics of Sound
- Duplex Theory of Temporal Representations of Sound
- Discussion on the Duplex Theory
- References.
The Physics of Sound
Before we discuss hearing, we must consider the question: what is sound? From everyday experience, we know that motion produces sound. Sounds can be of many frequencies and intensities, yet we manage to identify their source, location, and relevance to us, often with little to no conscious effort.
Sound is produced by waves traveling through a medium
Like light, sound is produced by waves as they move through a medium. A wave can be described as follows:
A wave is a movement of energy that causes periodic disturbances in a medium as it travels within that medium.
Let us unpack this definition, beginning with the word “disturbances.” To put this another way, a wave is a dissipation of energy through a medium. As it moves, the energy is lost as heat and to the particles in the medium. While the particles may experience local oscillations, they do not themselves move with, or ‘follow,’ the wave. To see this, consider the ‘wave’ done by crowds in large sporting events (below); a group of people jumps up and sits back down, and nearby people follow suit. Soon, the wave spreads around the whole stadium. Yet, nobody in the stadium was carried around with the wave – they all remain at their original seats.

Next, a wave “periodic“ because it contains features that repeat after specific periods of time. These periodic structures include amplitude, period, frequency, and waveform. Furthermore, despite the complex appearance of wave phenomena, such as ripples over water, most waves can be described by concise mathematical formulae. The simplest are sinusoids, which can be described by combinations of sine and cosine functions.
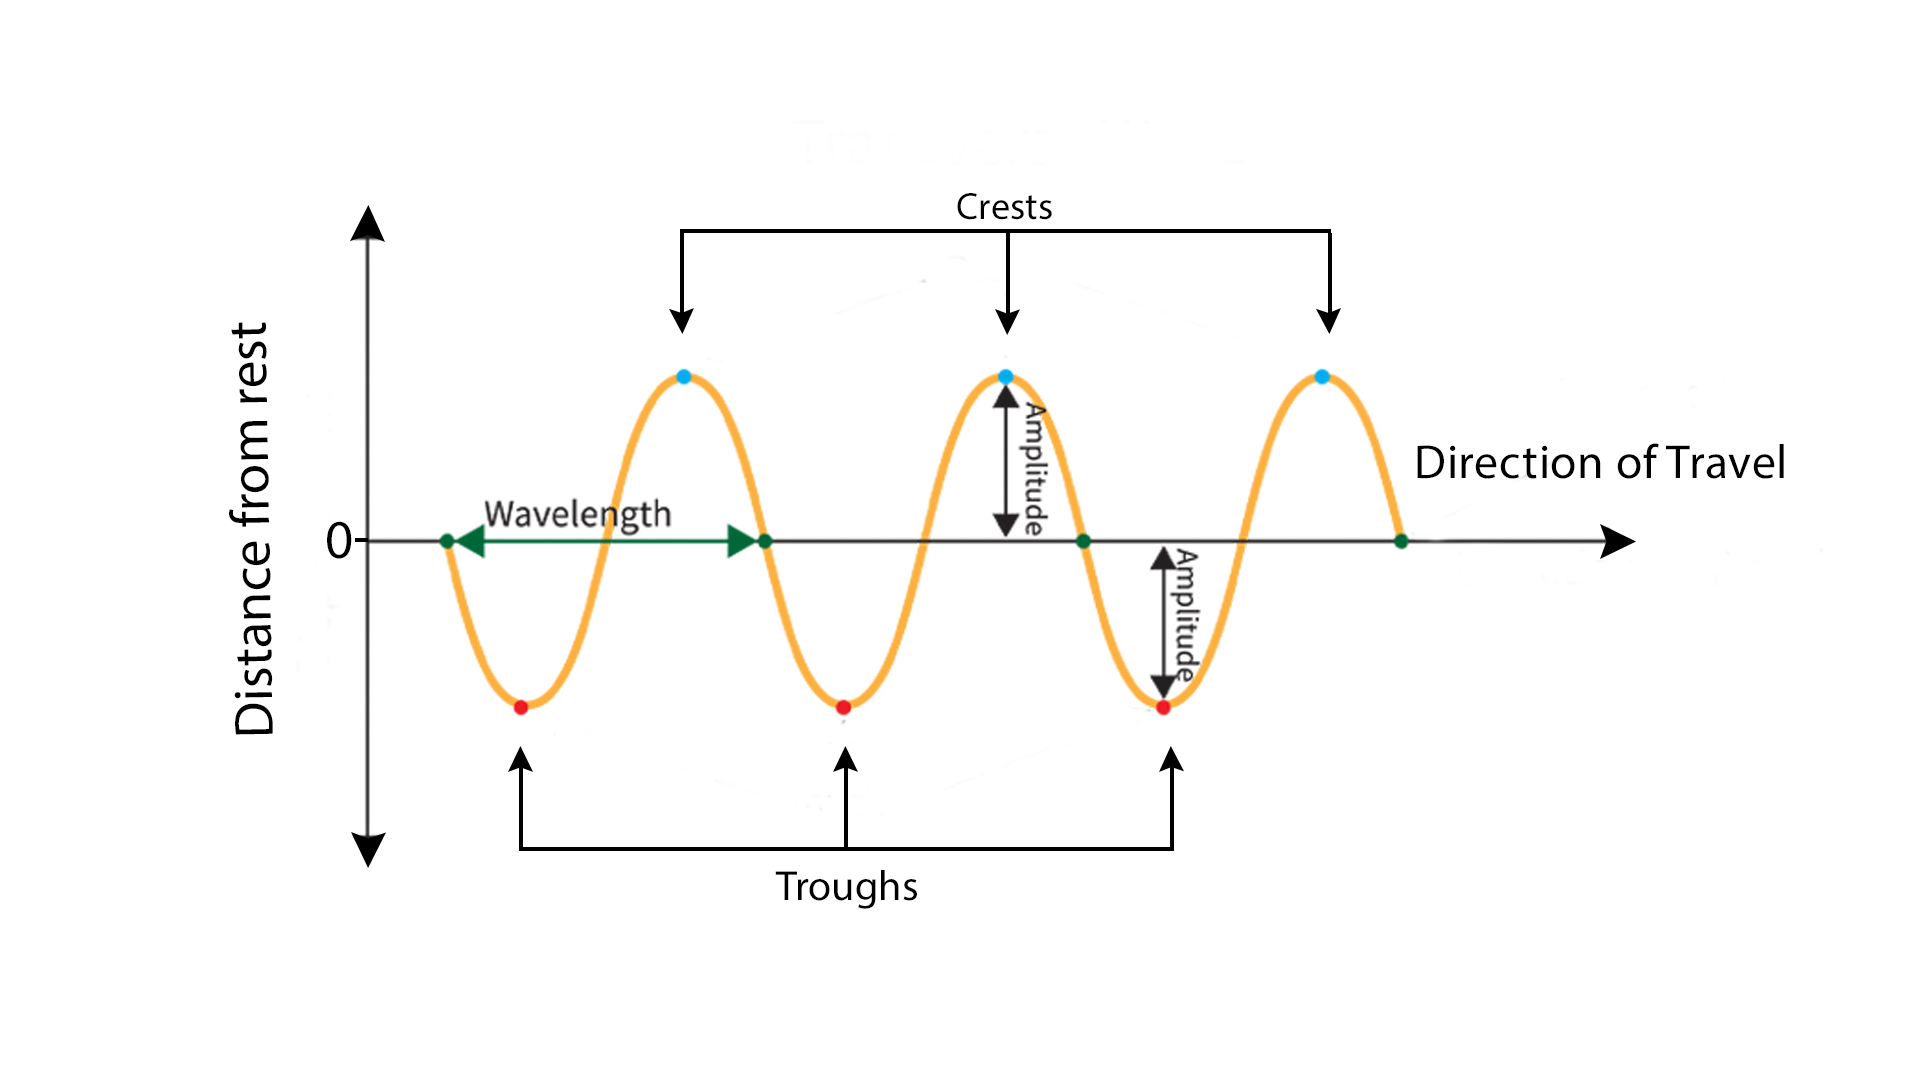
How waves move
Since they are periodic, any point or section of a wave ‘repeats’ over time, and the elapsed time or distance between repeat instances given by the wavelength and period, respectively. Thus, to track the movement of wave, we can pick any point or region – this is called a ‘phase’ and commonly denoted with a capital phi, $\Phi$. For example, the cosine and sine functions are equivalent up to a finite phase difference: $sin(\theta) \equiv \cos \left( \theta+\frac{\pi}{2} \right)$.
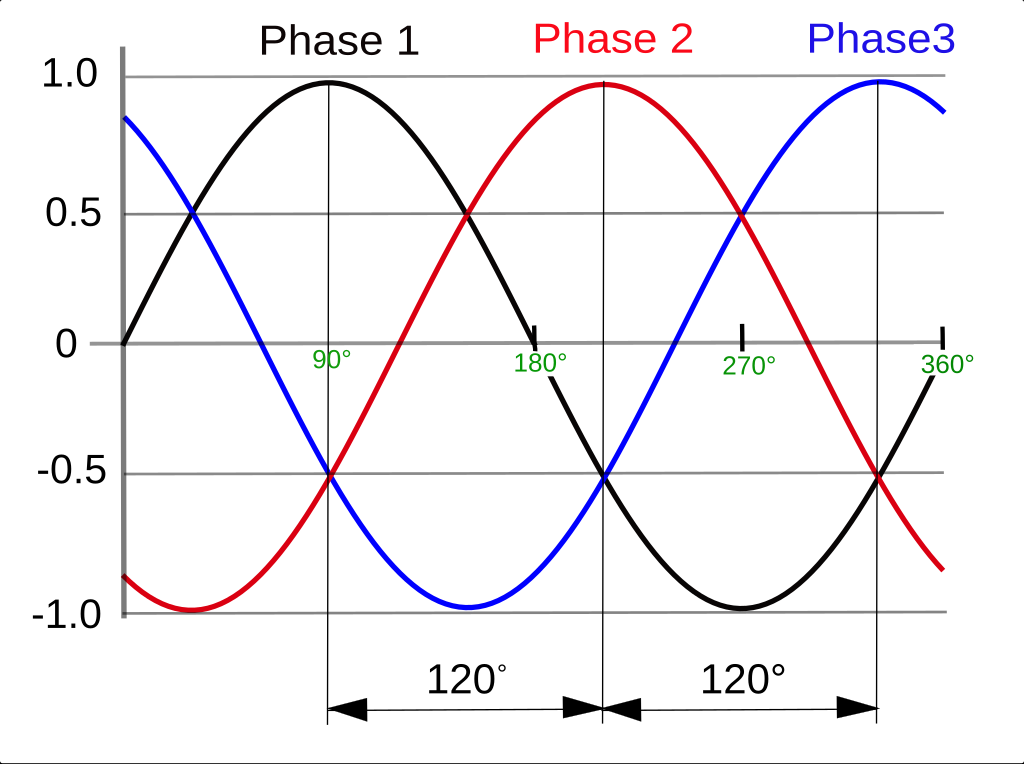
A phase is the position of a wave at a point in time (instant) on a waveform cycle. It provides a measurement of exactly where the wave is positioned within its cycle.
As a wave travels and spreads into space, points of equal phase (“equiphase”) spread out with it. A set of equiphase points is called a “wavefront,“ and move in the same direction of the wave. Ripples are an example of wavefronts, although the trough or any other point along a wave can be chosen. To show the direction of wave travel, rays are drawn that are perpendicular to the wavefronts. In other words, a wavefront is a surface of constant phase along the wave, and rays show the direction of propagation.
A ray is a line that is everywhere perpendicular (“normal”) to the surfaces of constant phase of the wave – wavefronts. Rays point in a local direction of the propagation of the wave.
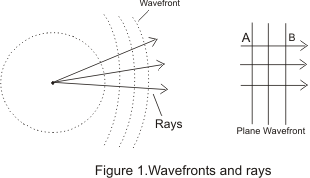
As waves move further from their source, the wavefronts become larger and the rays become straighter. At sufficiently far distance from the source, a similar-sized piece of the wavefront that was initially very curved (a) now appears flat (b).
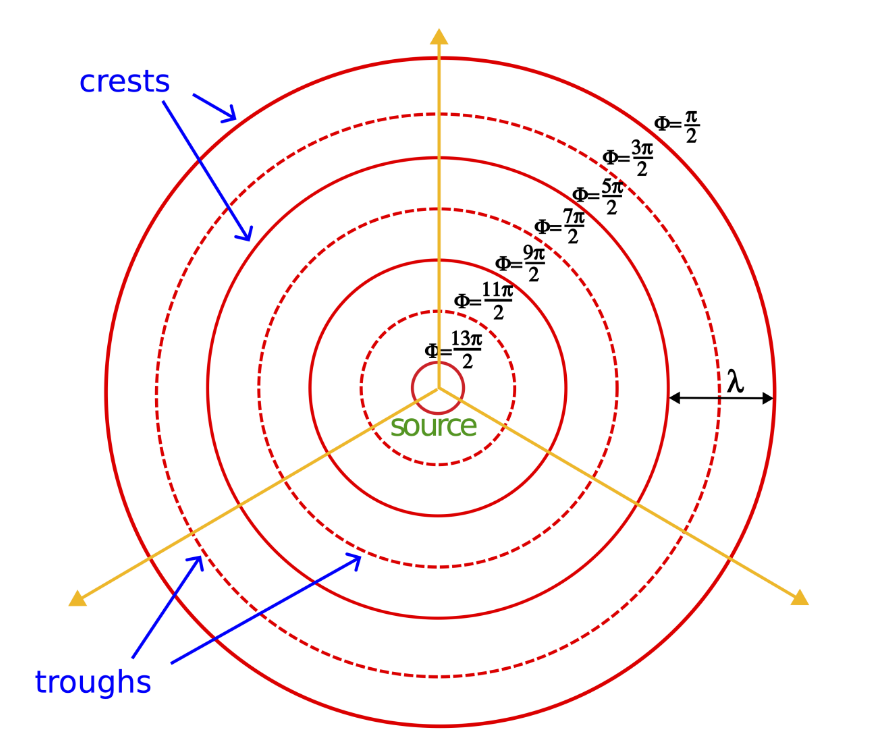
A drawing of two-dimensional wavefronts. Concentric circles are crests (solid lines) and troughs (dashed lines) emanate from the source at the center. The wavefronts spread as they move away from the source, like ripples in a pond.
The image above shows circular wavefronts propagating from a source. The furthest crest was the first crest generated from the source and, assuming the waves are standard sine functions, has phase $\pi/2$. The closest trough was generated half a cycle later, so it has a phase of $3\pi/2$. Thus, time “increases inward” from the furthest to the closest wavefront. Secondly, the distance between crests or between troughs is the wavelength. However, temporal information (frequency or period) is not available in the ‘top-down’ wavefront representation, which consequently also lacks information about amplitude.
How waves move matter
Sound is produced by the oscillation (back-and-forth vibration) of matter as a wave travels through a medium. Hence, no sound propagates in a vacuum such as in pockets of deep space. However, even from everyday experience, we understand that sounds fade with distance and, at sufficiently far distances, die out completely. There are two factors that contribute to the reduction in volume:
- Geometrical expansion: spreading of the wavefronts with distance
- Dissipative effects of the medium
Here, we will focus on the first effect, geometrical expansion. Dissipative effects of the medium include absorption or scattering by the medium. Absorption can be simply described as the energy of a wave being converted into heat in the medium, rather than causing oscillations. Scattering is the partial reflection of a wave by obstacles, which reduces the energy transmitted past the obstacle, although the total energy carried by both the scattered and unscattered parts of the wave remain unchanged.
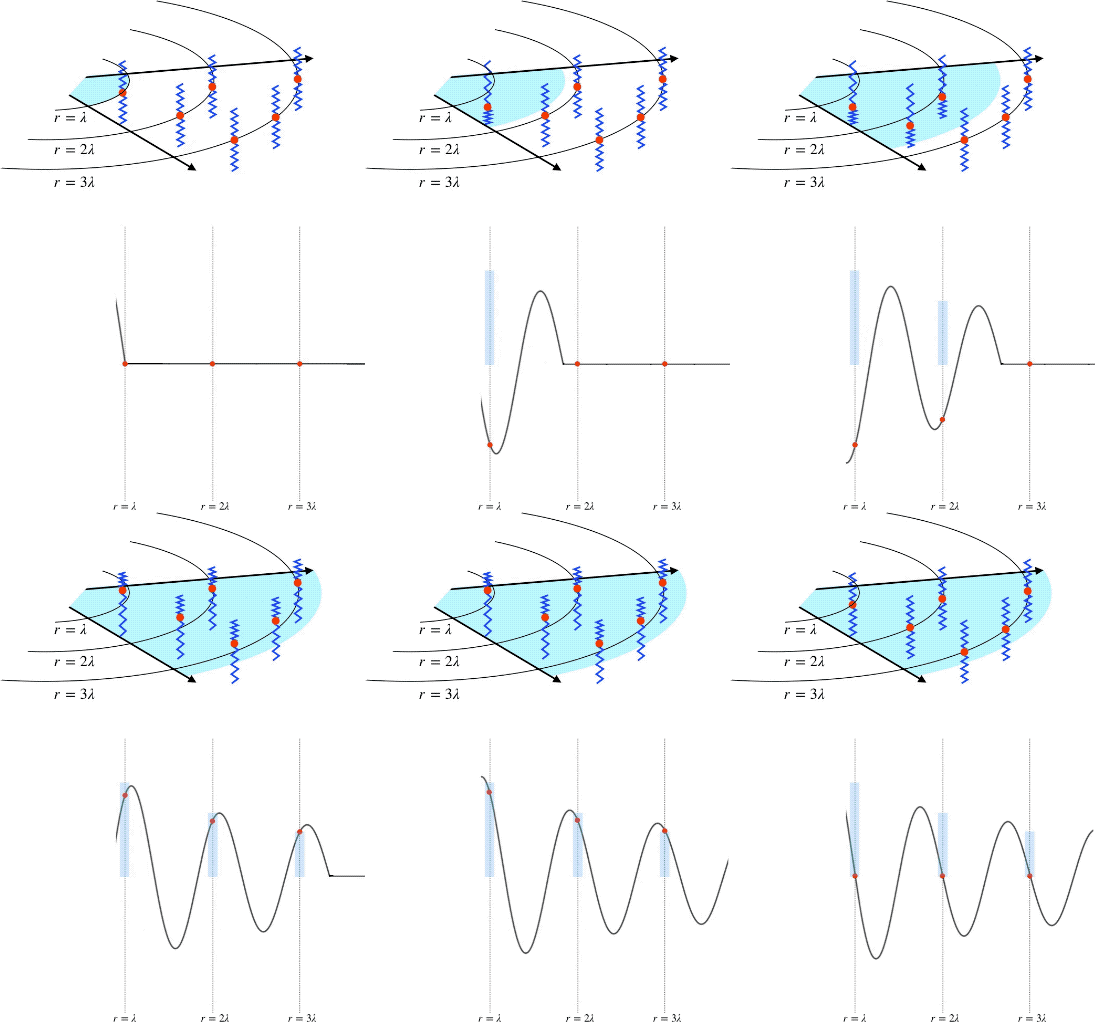
(Top) Propagation of circular wavefronts at radii of wavelengths 1, 2, and 3. (Bottom) The amplitude of oscillating particles in the medium at wavefront radii of wavelengths 1, 2, and 3. This is an animation that will not render in a PDF file. To see the animation, please go to:
Consider a wave spreading outwards in two dimensions, like a circular ripple on a pond caused by a pebble. Each point in the medium contains a particle and, as the ripple propagates outward, it causes more and more particles to oscillate. Since the medium is uniform (water), particles are equally spaced everywhere so that the number of particles that the circular wave (ripple) encounters at any distance from the source (where the pebble was dropped) is proportional to its circumference: as the wave travels outward, the ripple grows bigger, and more particles oscillate.

Waves spreading in 2D (left) and 3D (right). If the same amount of energy is distributed across a larger area, the intensity is necessarily lower at larger distances. From Ahlborn (2004).
We can quantify the energy lost with wave propagation as follows:
\[\begin{align*} E_{tot} &= \text{kinetic energy} \ + \text{(elastic) potential energy} \\ &= \frac{\text{mass} \times \text{velocity}^2}{2} + \frac{\text{spring constant} \times \text{displacement}^2}{2} \\ &= \frac{mv^2}{2} + \frac{kx^2}{2} \\ \end{align*}\]Now consider what happens when an oscillating particle is maximally displaced. This is analogous to an object being thrown vertically: the object stops (zero velocity) when it reaches maximum height when all initial kinetic energy has been transformed into potential energy. Since amplitude (A) is defined as the maximum displacement, the particle experiences zero velocity at $x=A$, so $E_{tot}$ reduces to:
\[E_{tot} = \frac{kA^2}{2} \implies E_{tot} \ \text{(energy per oscillator)} \propto A^2\]$E_{tot}$ being proportional to the square of oscillation amplitude tells us that, if $E_{tot}$ is halved, the oscillation amplitude will decrease by a factor of $\sqrt{2}$. Consequently, as the wave propagates outwards, the same initial energy becomes shared among a greater number of oscillators (particles).
Above, we established that the number of oscillators is proportional to the circumference. Since the circumference of a wave is directly proportional to its radius, amplitude is proportional to the inverse square root of radius:
\[r \propto N \propto 1/E_{tot} \propto 1/A^2 \implies A \propto 1/\sqrt{r}\]For example, a tripling of the radius causes:
- the number of oscillators increases by $3$-fold
- $E_{tot}$ decreases by $1/3$ times
- the amplitude of oscillations decreases by $1/\sqrt{3}$ times
Importantly, wave velocity does not change as a wave travels through a medium, because the velocity of a wave is determined by the properties of the medium. For example, air, being less dense than water, supports higher wave velocities.
If wave velocity is constant, then the total amount of energy in the wave must be the same at all distances from the source (radii of ripples). Thus, as it propagates, the total energy in the wave does not change, but its energy density does: a circular wavefront with smaller radii distributes the same amount of energy over a smaller circumference. Consequently, energy density decreases as the wave propagates outward, which explains why light and sound fade with distance.
If, as above, we measure the amount of energy passing through a region of the wave (energy density), but over a specific time interval, we now have the power density or “intensity” of the wave in that region of space and interval of time. Mathematically,
\[\begin{align*} \text{Intensity(radius)} &= \frac{\text{Power}}{\text{Circumference}} \\[5pt] &= \frac{\text{Energy/Time}}{\text{Circumference}} \\[5pt] I(r) &= \frac{\Delta E/\Delta t}{2\pi r} \end{align*}\]Taking our results above, we find that intensity is proportional to the square of amplitude and inversely proportional to radius:
\[I \propto E_{tot} \propto A^2 \propto 1/r\]How waves change direction
There are three major ways in which waves change direction: reflection, refraction, and diffraction. We will focus on diffraction, but it is important to at least understand that refraction occurs when waves enter a different medium that changes their speed and direction. Reflection, on the other hand, bounces a wave backwards.
Diffraction occurs when waves encounter an obstacle or opening. The extent and nature of diffraction depends on the relative sizes of the obstacle and wavelength $\lambda$. We mainly consider two cases:
- If the wavelength $\lambda$ is large compared to the width $d$ of the obstacle or opening, the wave wrap around the obstacle or opening. As $\lambda$ increases relative to $d$, the amount of diffraction (sharpness of bending) increases.
- If the wavelength $\lambda$ is small compared to the width $d$ of the obstacle or opening, no diffraction will occur.
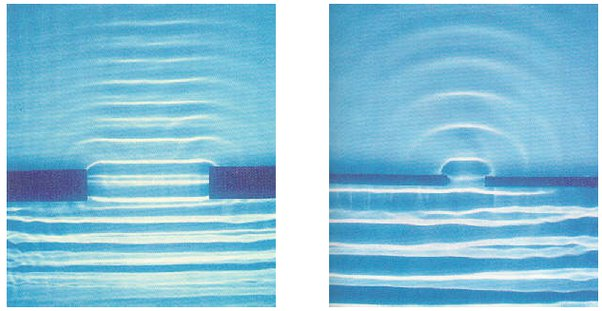
Diffraction of water waves through a slit. In a large slit (left), the wavelength is relatively small, and does not diffract much, producing very few waves on the left and right sides beyond the slit. When the slit is small (right), the waves diffract more.
Duplex Theory of Temporal Representations of Sound
Locating sounds in the horizontal plane requires both ears and central neurons that compare the input from each ear. In this section, we discuss the classic Duplex Theory of sound localization. The main points are as follows:
- The sounds we hear are distorted by the shape and location of our ears.
- To localize sound, the brain compares the timing and intensity of input to the ears.
- The Duplex Theory proposes that, due to the wave behaviour of sound, compare the intensities to localize high-frequency sounds and time delays to localize low-frequency sounds.
For high-frequency sounds (2-20 kHz), the most important criterion is the interaural intensity difference (IID, also ILD for ‘interaural level difference’). This is because frequency and wavelength are inversely proportional, and diffraction only occurs when sound waves encounter obstacles or openings that are larger than their wavelengths. Thus, high frequency sounds will not diffract around the skull, which casts a ‘shadow’ on the other side. Hence, the ear on the opposite side of the sound source (contralateral ear) will hear the sound quieter.
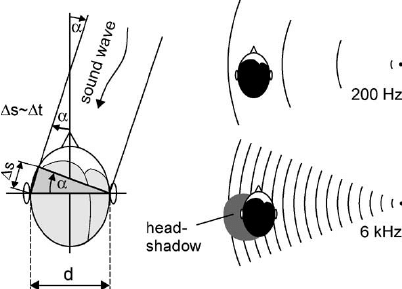
Interaural differences used to distinguish low and high frequency sounds
Low-frequency sounds (below ~2 kHz) diffract around the head, so both ears hear the same sound as having comparable intensity. Thus, rather than intensity, input from each ear is compared by measuring their temporal separation: the interaural delay (or, interaural time difference, ITD).
The ITD reaches a maximum of about 0.6-0.8 ms when the sound source is directly opposite one ear ($90\degree$, see schematic below), and decreases as the angle departs from $90\degree$. For example, if we assume a head of diameter 20 cm, a 200 Hz sound coming directly 45$\degree$ ahead will have an ITD of ~0.4 ms. Using symbols in the figure above, this result is calculated as follows:
\[\Delta t = \frac{d \sin \alpha}{v} = \frac{(20 \ \text{cm})\sin 45\degree}{343 \ \text{m/s}} \approx 0.412 \ \text{ms}\] and vertical (elevation) planes..png)
Angles of sound heard along the horizontal (azimuth) and vertical (elevation) planes.
Discussion on the Duplex Theory
I would like you to think about implications and further ways to test sound localization. We will start with the following – the problem of localizing sounds in front and behind us.
The problem of front-back localization
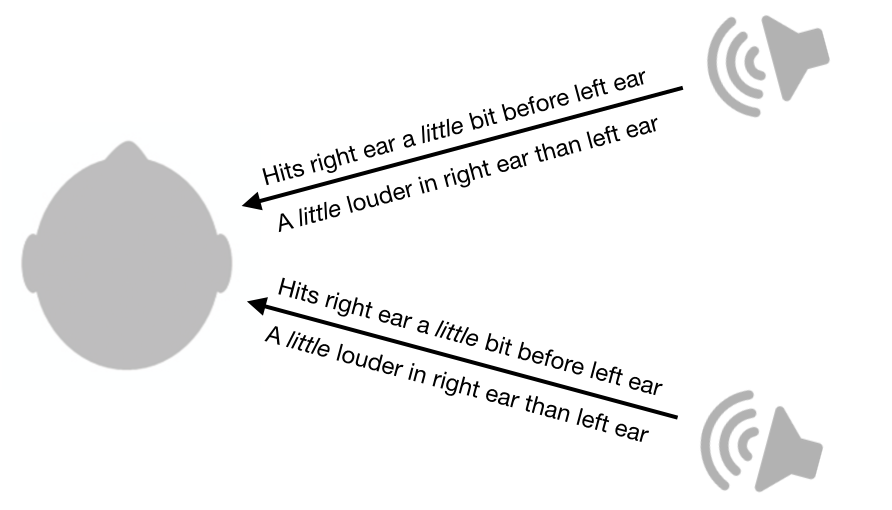
Sounds coming from the front-right and back-right sound similar in terms of intensity and timing.
The symmetry of the head and ears produces a cone of confusion (see below) – sound from the front-right and back-right (at equal angles from the median) should sound identical. This is true for any sounds that originate along the circumference of a cone positioned at any distance from the ear. We cannot tell whether such sounds come from – front, back, top, bottom, or anywhere else.
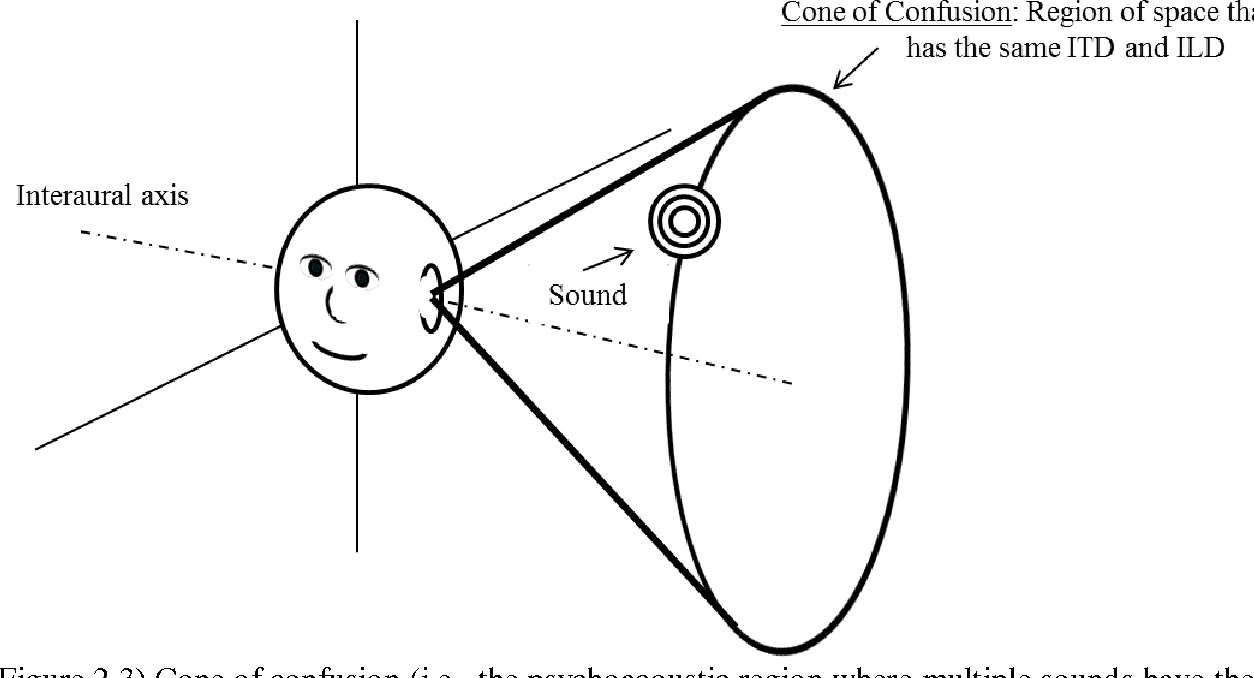
The “cone of confusion” is a conical surface that extends out from the ear. Sounds originating from different locations on this surface all have the same interaural level difference and interaural time difference, so information provided by these cues is ambiguous.
Resolving the cone of confusion
While the ambiguities are negligible when the sound is very close or very far, we are still able to distinguish whether sounds at intermediate distances (e.g. 1-5 meters) are coming from the front or back, even if they fall along the cone of confusion. The major reason is that we tilt our heads. This shifts both the amplitude and phase of sound waves arriving at each ear, and shifts the axis of the head and cone of confusion so that ITDs and ILDs become noticeable.
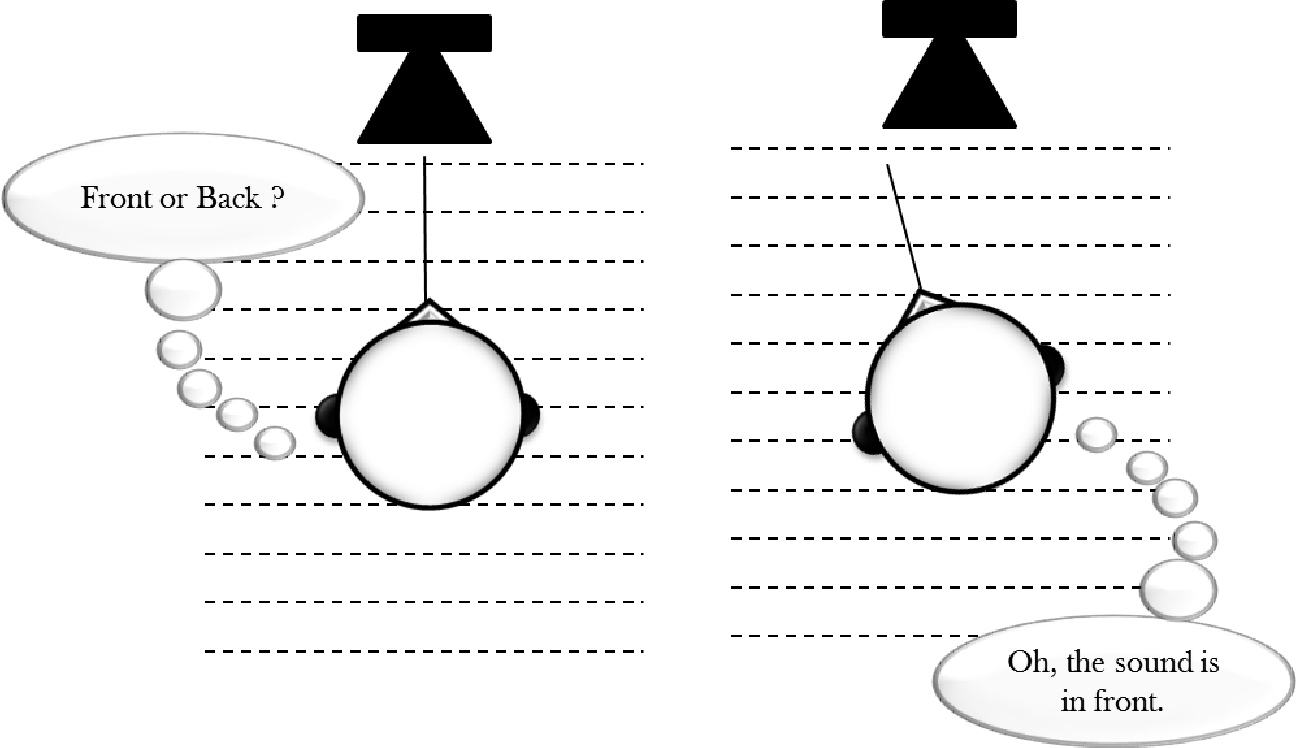
Head movement can be used to localize a sound source by shifting the interaural axis.
However, even without moving our heads, we can still distinguish sounds on the front-back axis quite well. This is primarily because of reflection. Most of the sounds we hear do not enter our ear canals directly. Rather, most sound is reflected off the curves and folds of the external ear, delaying their entry into the inner ear. Reflecting waves have different properties from those that enter the ear directly, and by learning these differences, we can localize sounds without relying on head movement.
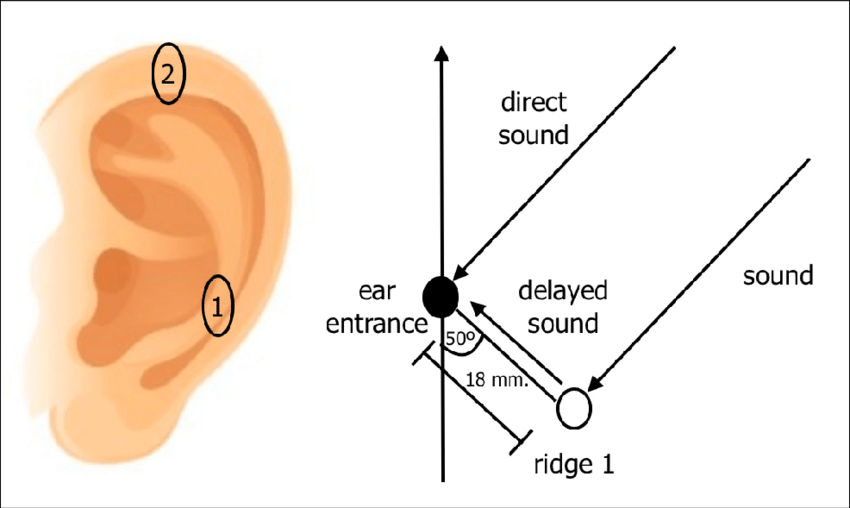
Reflection of sound waves off the pinna and ridges (1, 2) provide cues on horizontal and vertical sound direction.
As sound waves strike a listener, they diffract and reflect around the head and shoulders. The nature and extent of diffraction and reflection is thus dependent on the size and shape of the head, ears, mouth, and shoulders, all of which transform the input and affect how it is perceived, boosting some frequencies and lowering others. In other words, the output of diffraction and reflection is unique to each individual and transforms sound inputs in a frequency-dependent manner. This unique transformation is called the Head-Related Transfer Function (HRTF).
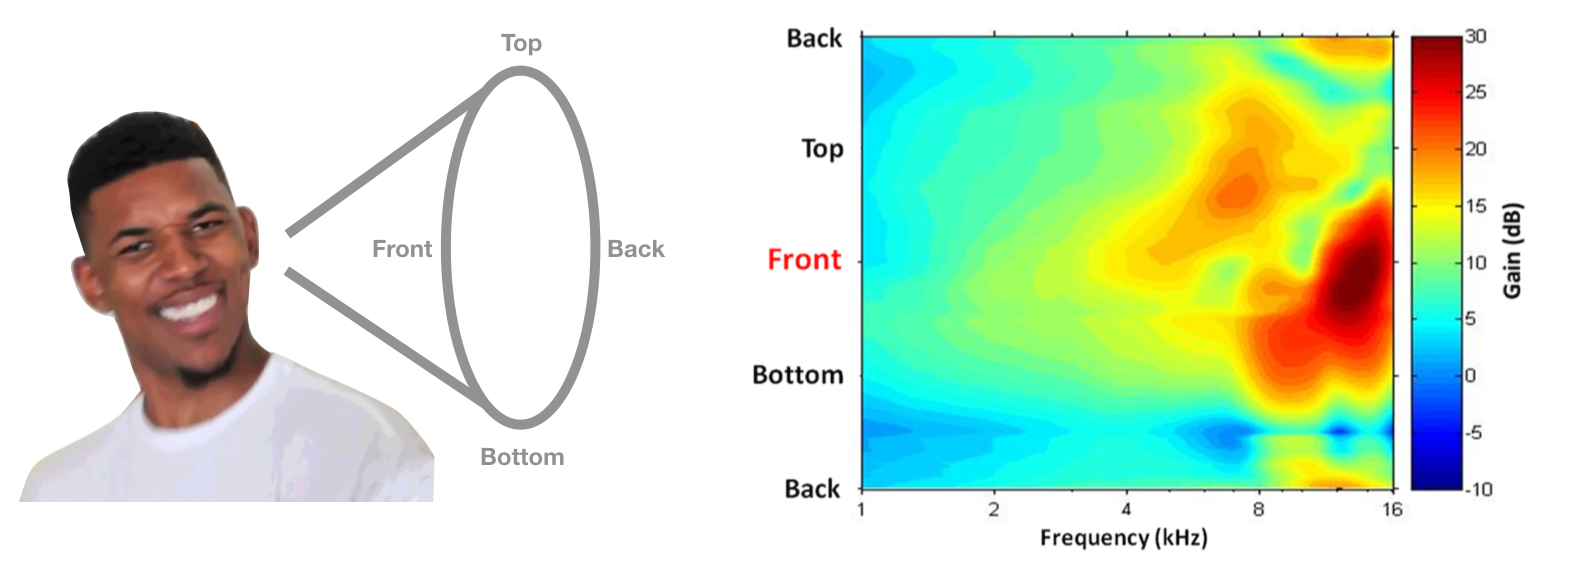
The cone wraps around the head along the vertical plane, hence the repeating label “Back” on the graph on the right. If you had this HRTF (right), you might think a sound is coming from the front if it has more high frequency power than you’d expect.
References.
Textbooks
- Ahlborn, Zoological Physics
- Boron, Medical Physiology 4e
Research articles
- Willert, V., Eggert, J., Adamy, J., Stahl, R., & Korner, E. (2006). A Probabilistic Model for Binaural Sound Localization. IEEE Transactions on Systems, Man and Cybernetics, Part B (Cybernetics), 36(5), 982–994. doi:10.1109/tsmcb.2006.872263
- Ren et al.,( 2019). Replay attack detection based on distortion by loudspeaker for voice authentication
- Wightman and Kistler (1993). Sound localization.
- Middlebrooks and Green (1991). Sound localization by human listeners.
- Middlebrooks, J. C., & Green, D. M. (1991). Sound Localization by Human Listeners. Annual Review of Psychology, 42(1), 135–159. doi:10.1146/annurev.ps.42.020191.
- Lopez-Moliner and Soto-Faraco (2007). Vision affects how fast we hear sounds move.
- Slattery, W. H., & Middlebrooks, J. C. (1994). Monaural sound localization: Acute versus chronic unilateral impairment. Hearing Research, 75(1-2), 38–46. doi:10.1016/0378-5955(94)90053-1
- Carlile and Leung (2016). The Perception of Auditory Motion
- Wood KC, Bizley JK. Relative sound localisation abilities in human listeners. J Acoust Soc Am. 2015 Aug;138(2):674-86. doi: 10.1121/1.4923452. Erratum in: J Acoust Soc Am. 2016 Jun;139(6):3043. PMID: 26328685; PMCID: PMC4610194.
Other
