
Analyzing my MCAT data
Published:
There are two datasets that I would like to analyze regarding how I prepared for my most recent MCAT exam on August 13th, 2022. First, a month’s worth of CARS practice. Secondly, how I spent my time in the last week of studying. There’s a chance of one or more subsequent posts about these data, since I haven’t really come to terms yet with how I should/can analyze these data.
Introduction.
The MCAT (Medical College Admission Test) is an exam widely used by admissions committees in medical schools throughout North America. As of 2015, the MCAT consists of four sections:
| Section | Questions | Minutes |
|---|---|---|
| Chemical and Physical Foundations of Biological Systems (CP) | 59 | 95 |
| Critical Analysis and Reasoning Skills (CARS) | 53 | 90 |
| Biological and Biochemical Foundations of Living Systems (BB) | 59 | 95 |
| Psychological, Social and Biological Foundations of Behavior (PS) | 59 | 95 |
I wrote the MCAT exam on August 13th, 2022. I started practicing CARS on July 15th, 2022 and, everyday from then until August 12th, 2022, I tried to complete nine CARS passages - the equivalent of a full CARS section in an MCAT exam. In general, I used third-party resources, but also purchased a CARS Question Pack from the official AAMC store. Below is a list of the resources that I used for CARS:
- NextStep Verbal Practice (NS101)
- The Princeton Review’s CARS Workbook (2016; TPR)
- Khan Academy (KA)
- Jack Westin (JW)
- Examkrackers 101 Verbal Reasoning Passages (EK101)
- AAMC CARS Question Pack 2 (AAMC QP2)
Methods.
Data collection - CARS.
For each CARS passage, I used the stopwatch functionality of Windows 10’s native Clock application to manually record the time I spent reading versus answering questions. After completing one passage, I moved on to the next without stopping, and calculated my scores at the very end.
Without exception, I always started by reading a passage, and did not preview questions before fully reading the passage. Time spent answering questions was defined as the time spent on the passage after having fully read the passage. Thus, even though I often referred back to the passage while answering questions, this was also included in time spent on the questions, and considered from the initial reading time. Furthermore, when practicing, I never reviewed previous passages.
The data were collected in a single spreadsheet, CARS.xlsx, which was then further analyzed.
Data collection - final week of studying.
To track the efficiency of my studying, I started using PomodoroLogger to schedule and record my study sessions. Study sessions were categorized by defining tasks in PomodoroLogger.
In addition to these data, I also kept adding daily updates in Daylio, an iPhone app that I use to track my mood, completion of various activities (e.g. exercise, studying, etc.), and other happenings.
Data from PomodoroLogger and Daylio were exported from their respective applications as JSON files and then further analyzed.
CARS data and analysis.
In this section, I will:
- Present how my CARS performance changed over the entire study period of 27 days.
- Examine differences between practice material.
Changes in CARS performance over time.
Initially, I noticed that my timing improved quite quickly. I wanted to eventually finish each passage within six minutes, which would leave roughly 30 minutes to spare in a full-length exam. On the first day, I spent about 9 minutes per passage (min/psg), but only about 7.5 min/psg on my second day. Whereas my score did not improve dramatically over the course of several weeks, 24 days later (August 4th), I had shaved off nearly 1.5 min/psg on average.
The increase in overall passage speed on the first day was attributable to being faster at both reading and answering questions, to roughly equal proportions. Later on, however, 70-75% of the decrease in overall passage time was due to a decrease in time spent reading, rather than time spent answering questions.
Notably, for roughly one week between July 30th and August 4th, my scores continued to decrease quite dramatically below their averages. However, the decreasing trend in reading and question-answering speed were not significantly impacted by this slump. Furthermore, I was eventually able to recover from this slump, but both the slump and recovery may be attributable to changes in practice material.
- Overall score: Overall percentage score for all passages completed in a given day.
- Total passage time: Total time (in minutes) spent on a passage (reading and answering questions).
- Passage reading time: Total time (in minutes) spent reading each passage.
- Passage question time: Total time (in minutes) spent answering questions in each passage.
- Individual question time: Average time (in minutes) spent on each question in each passage
- Reading/question time: The ratio of time spent reading versus answering questions, in each passage.
Errorbars indicate standard error of the mean (s.e.m) of all passages completed in a single day. Black dashes show a 5-day moving average of the means (circles). The s.e.m of the 5-day moving average is shown by the gray region.
How are exams structured? Most, but not all, practice materials were structured as practice exams. Pooling data from all dates and companies (e.g. AAMC, TPR, etc.), my timing seemed to be fairly consistent from passage-to-passage, whereas my overall score tended to suffer considerably in the middle passages. It is unclear whether this decrease in performance is due to the passages being more difficult, or because of a personal characteristic.  **Figure 2. Score and timing per passage.** Percentage score (left) and overall time (in minutes, right) for the first nine passages completed in a given day, for all days in the dataset. *Errorbars in both plots show SEM. Boxplots (right) extend from the first to the third quartiles. Black dots and white dashes inside boxes indicate means and medians, respectively. Black diamonds indicate outliers.* Another important consideration is the amount of time I 'waste' when I spend longer than usual reading a passage or answering its questions. Intuitively, I may 'waste' time doing so because I may lose time better spent on later passages. To quantify the amount and effect of wasted time, I compared my timing and score for each passage to their expected values based on uniform performance. For example, if I scored 80% and spent 63-minutes on a 9-passage practice test, then, uniform performance would lead me to expect that I scored 80% and spent 7-minutes on each individual passage. Subtracting the expected values, I get a value for the 'excess' time and score for each passage: $$ \begin{aligned} \textbf{Raw values} \quad t_i&, \quad s_i \\ \textbf{Uniform performance} \quad t_U &= \frac{\sum^N_{i=1} t_i}{N}, \quad s_U = \frac{\sum^N_{i=1} s_i}{N} \\ \textbf{Excess performance} \quad t_{xs} &= t_i - t_U, \quad s_{xs} = s_i - s_U \\ \end{aligned} $$ If the excess time is positive, then I spent longer than expected on that passage, based on what was expected from uniform performance. Similarly, if the excess score on a passage is negative, then I scored lower than expected. I often spend less time than expected reading passages and answering questions (55% and 56% of passages, respectively). Furthermore, in 60% of passages where I read or answer questions faster than expected, I also score better. However, if I spend more time than expected reading or answer questions, I am nearly 1.6x more likely to score lower than score better. Therefore, the take-away seems to be that I should generally feel comfortable with my timing, but be careful if I'm spending longer than usual on a passage.  **Figure 3. Visualization of excess performance.** Excess points (score) per passage, versus excess reading time (top), question time (middle), and total time (bottom) per passage. *Circles indicate data from individual passages. White crosses indicate passages from the most recent day in the data. Shaded regions of brighter colour correspond to greater density of passages in the indicated region. Dashed lines indicate the positions of zeroes (daily means based on uniform performance). Labelled percentages indicate the percent of all passages within the indicated quadrants. The passages may not sum to 100% due to rounding.* ### Comparing different companies' CARS resources. First, I want to know whether passages from different companies differed in the three main metrics presented above, namely, reading time, question time, and percent score. To do this comparison, I used a multivariate analysis-of-variances (MANOVA) test with [Pillai's trace](https://online.stat.psu.edu/stat505/lesson/8/8.3) as the test statistic. Pillai's trace was chosen as the test statistic because most of the assumptions required for MANOVA are violated in our data: #### Checking MANOVA assumptions. 1. Homogeneity of variances and covariances. To check equal variances, we use Levene's test: |variable | df1| df2| statistic| p| |:----------|---:|---:|---------:|---------:| |pct | 5| 237| 2.612093| 0.0253957| |t_question | 5| 237| 3.564348| 0.0039792| |t_read | 5| 237| 1.744274| 0.1252767| and Box's M test for variance-covariance matrices: | statistic| p.value| parameter|method | |---------:|-------:|---------:|:---------------------------------------------------| | 150.4087| 0| 30|Box's M-test for Homogeneity of Covariance Matrices | 2. Linearity |var1 |var2 | cor| statistic| p|method | |:----------|:----------|-----:|---------:|--------:|:--------| |t_read |t_question | 0.24| 1825167| 1.95e-04|Spearman | |t_read |pct | -0.22| 2914882| 5.90e-04|Spearman | |t_question |t_read | 0.24| 1825167| 1.95e-04|Spearman | |t_question |pct | -0.33| 3184723| 1.00e-07|Spearman | |pct |t_read | -0.22| 2914882| 5.90e-04|Spearman | |pct |t_question | -0.33| 3184723| 1.00e-07|Spearman | 3. Normality
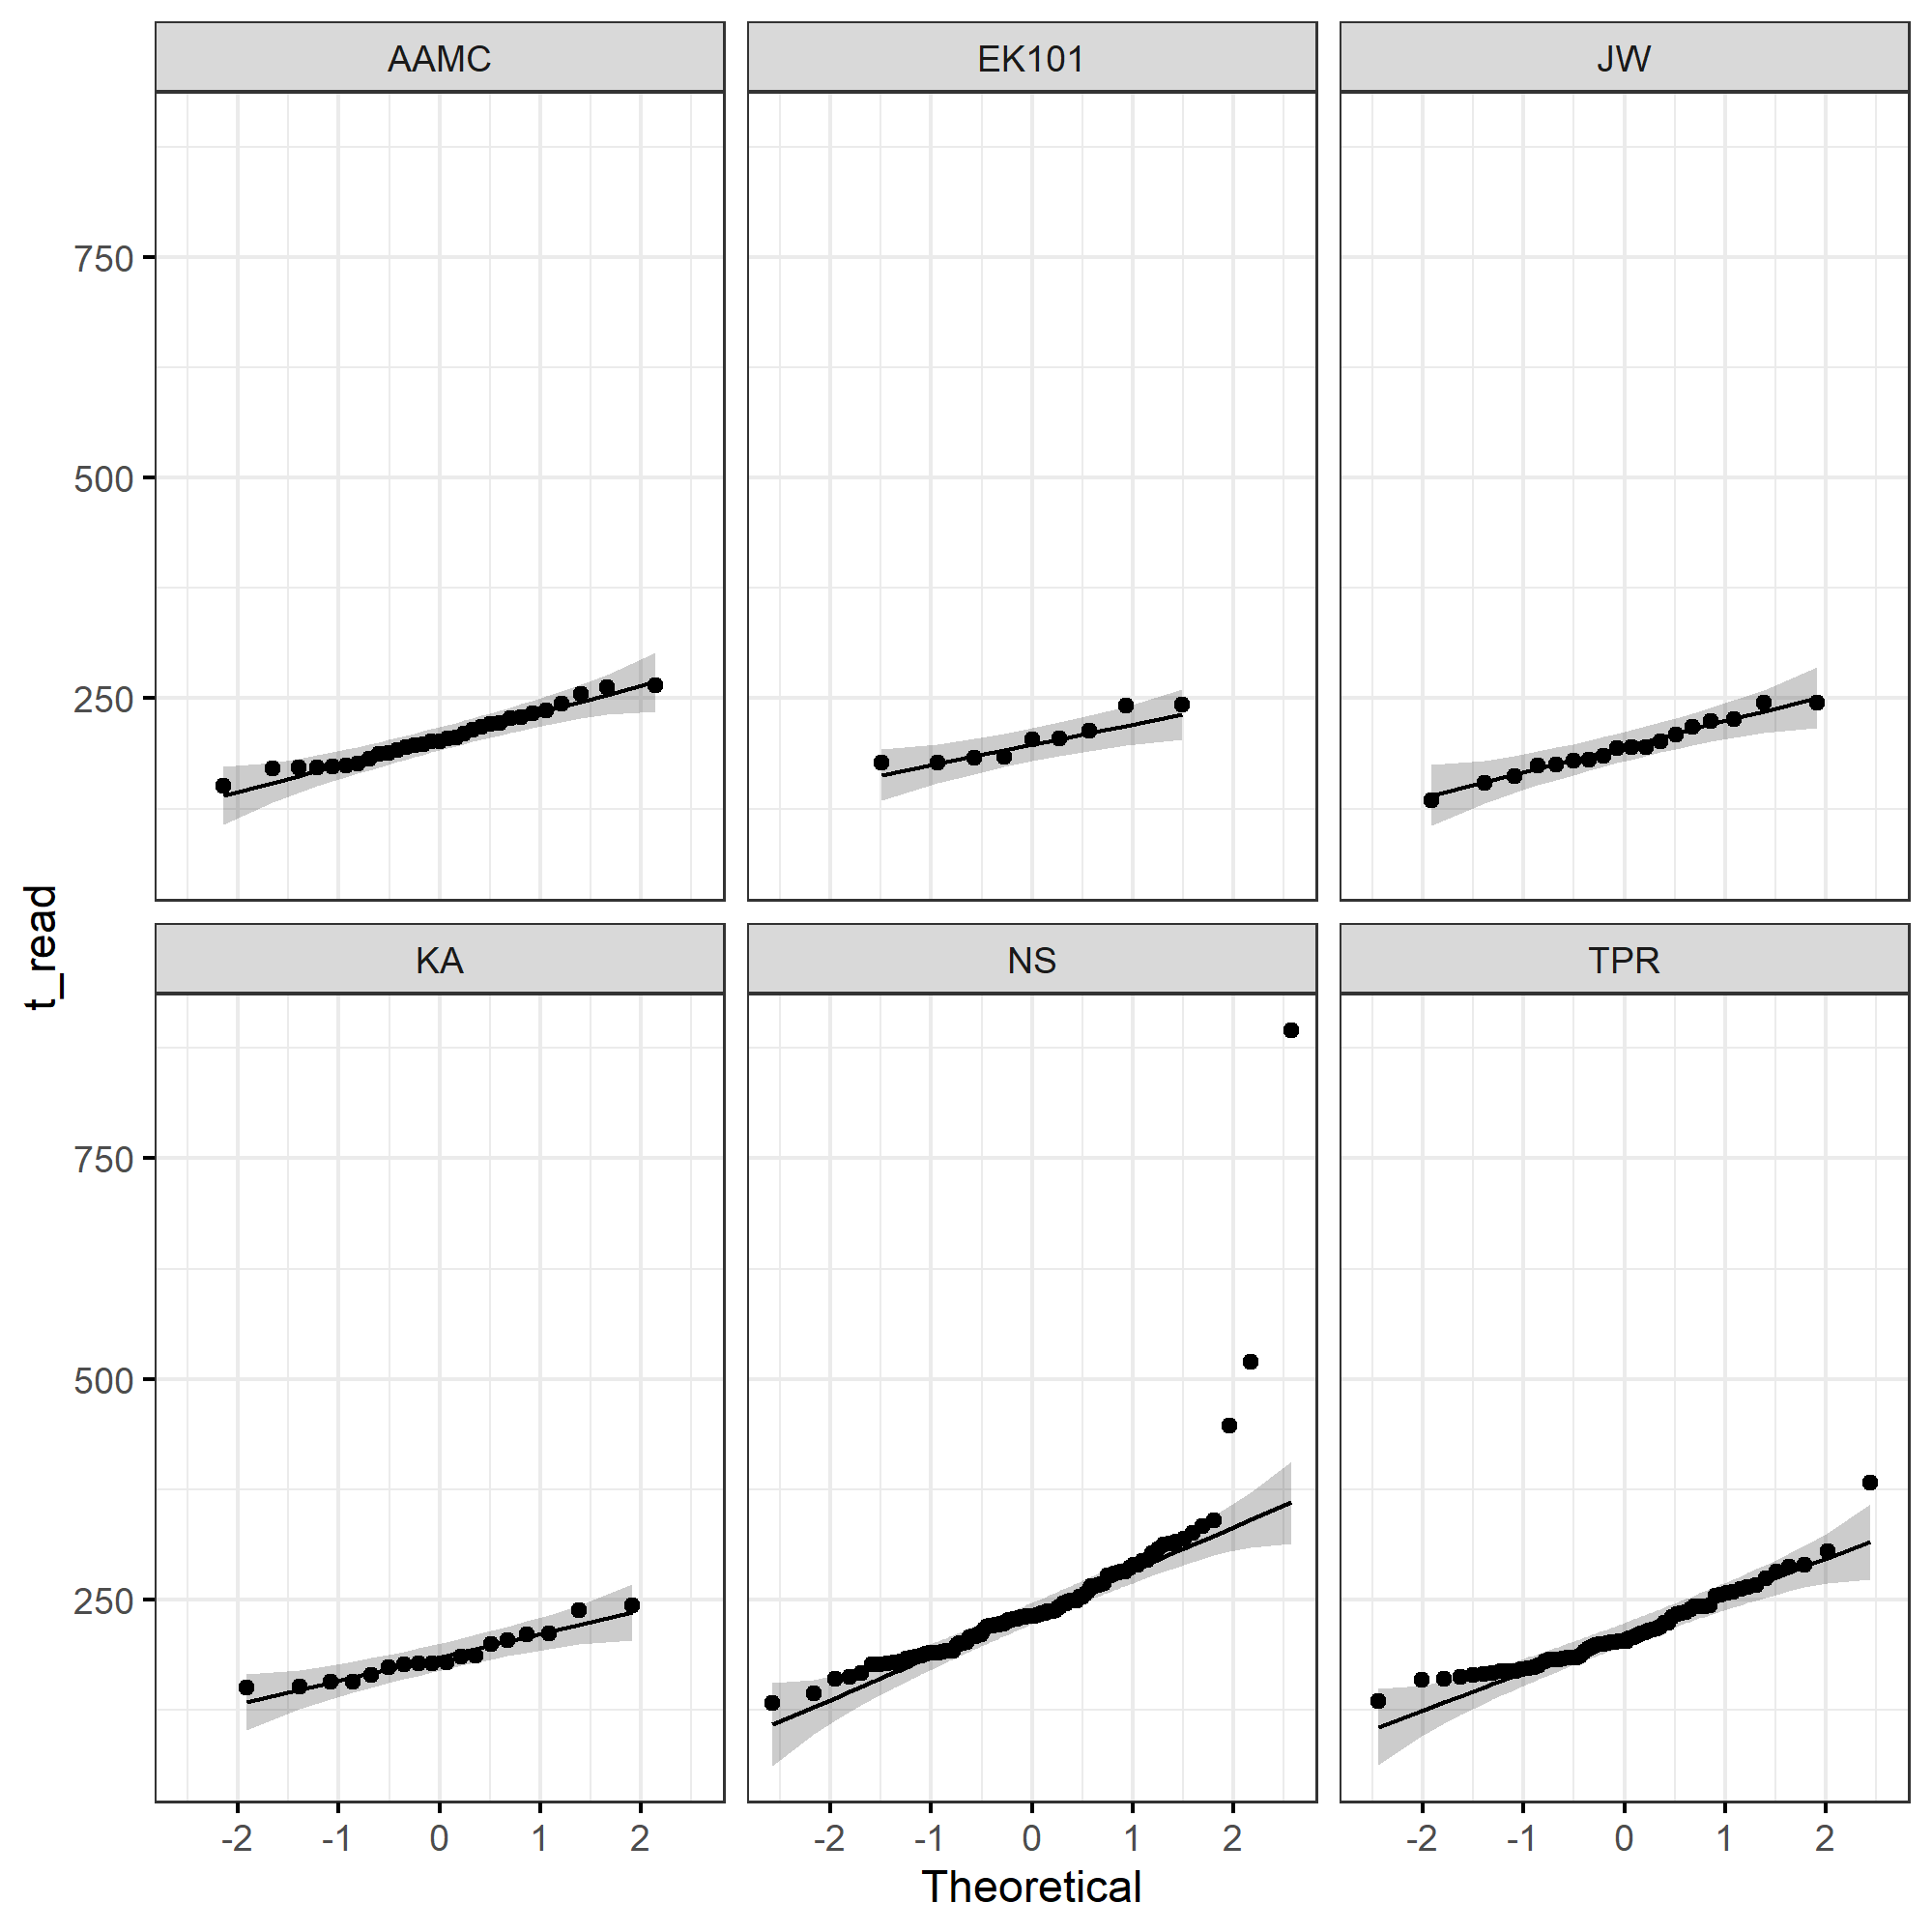
QQ plots for reading times.
Besides some large outliers in NS and TPR, most companies' data look fairly normal.
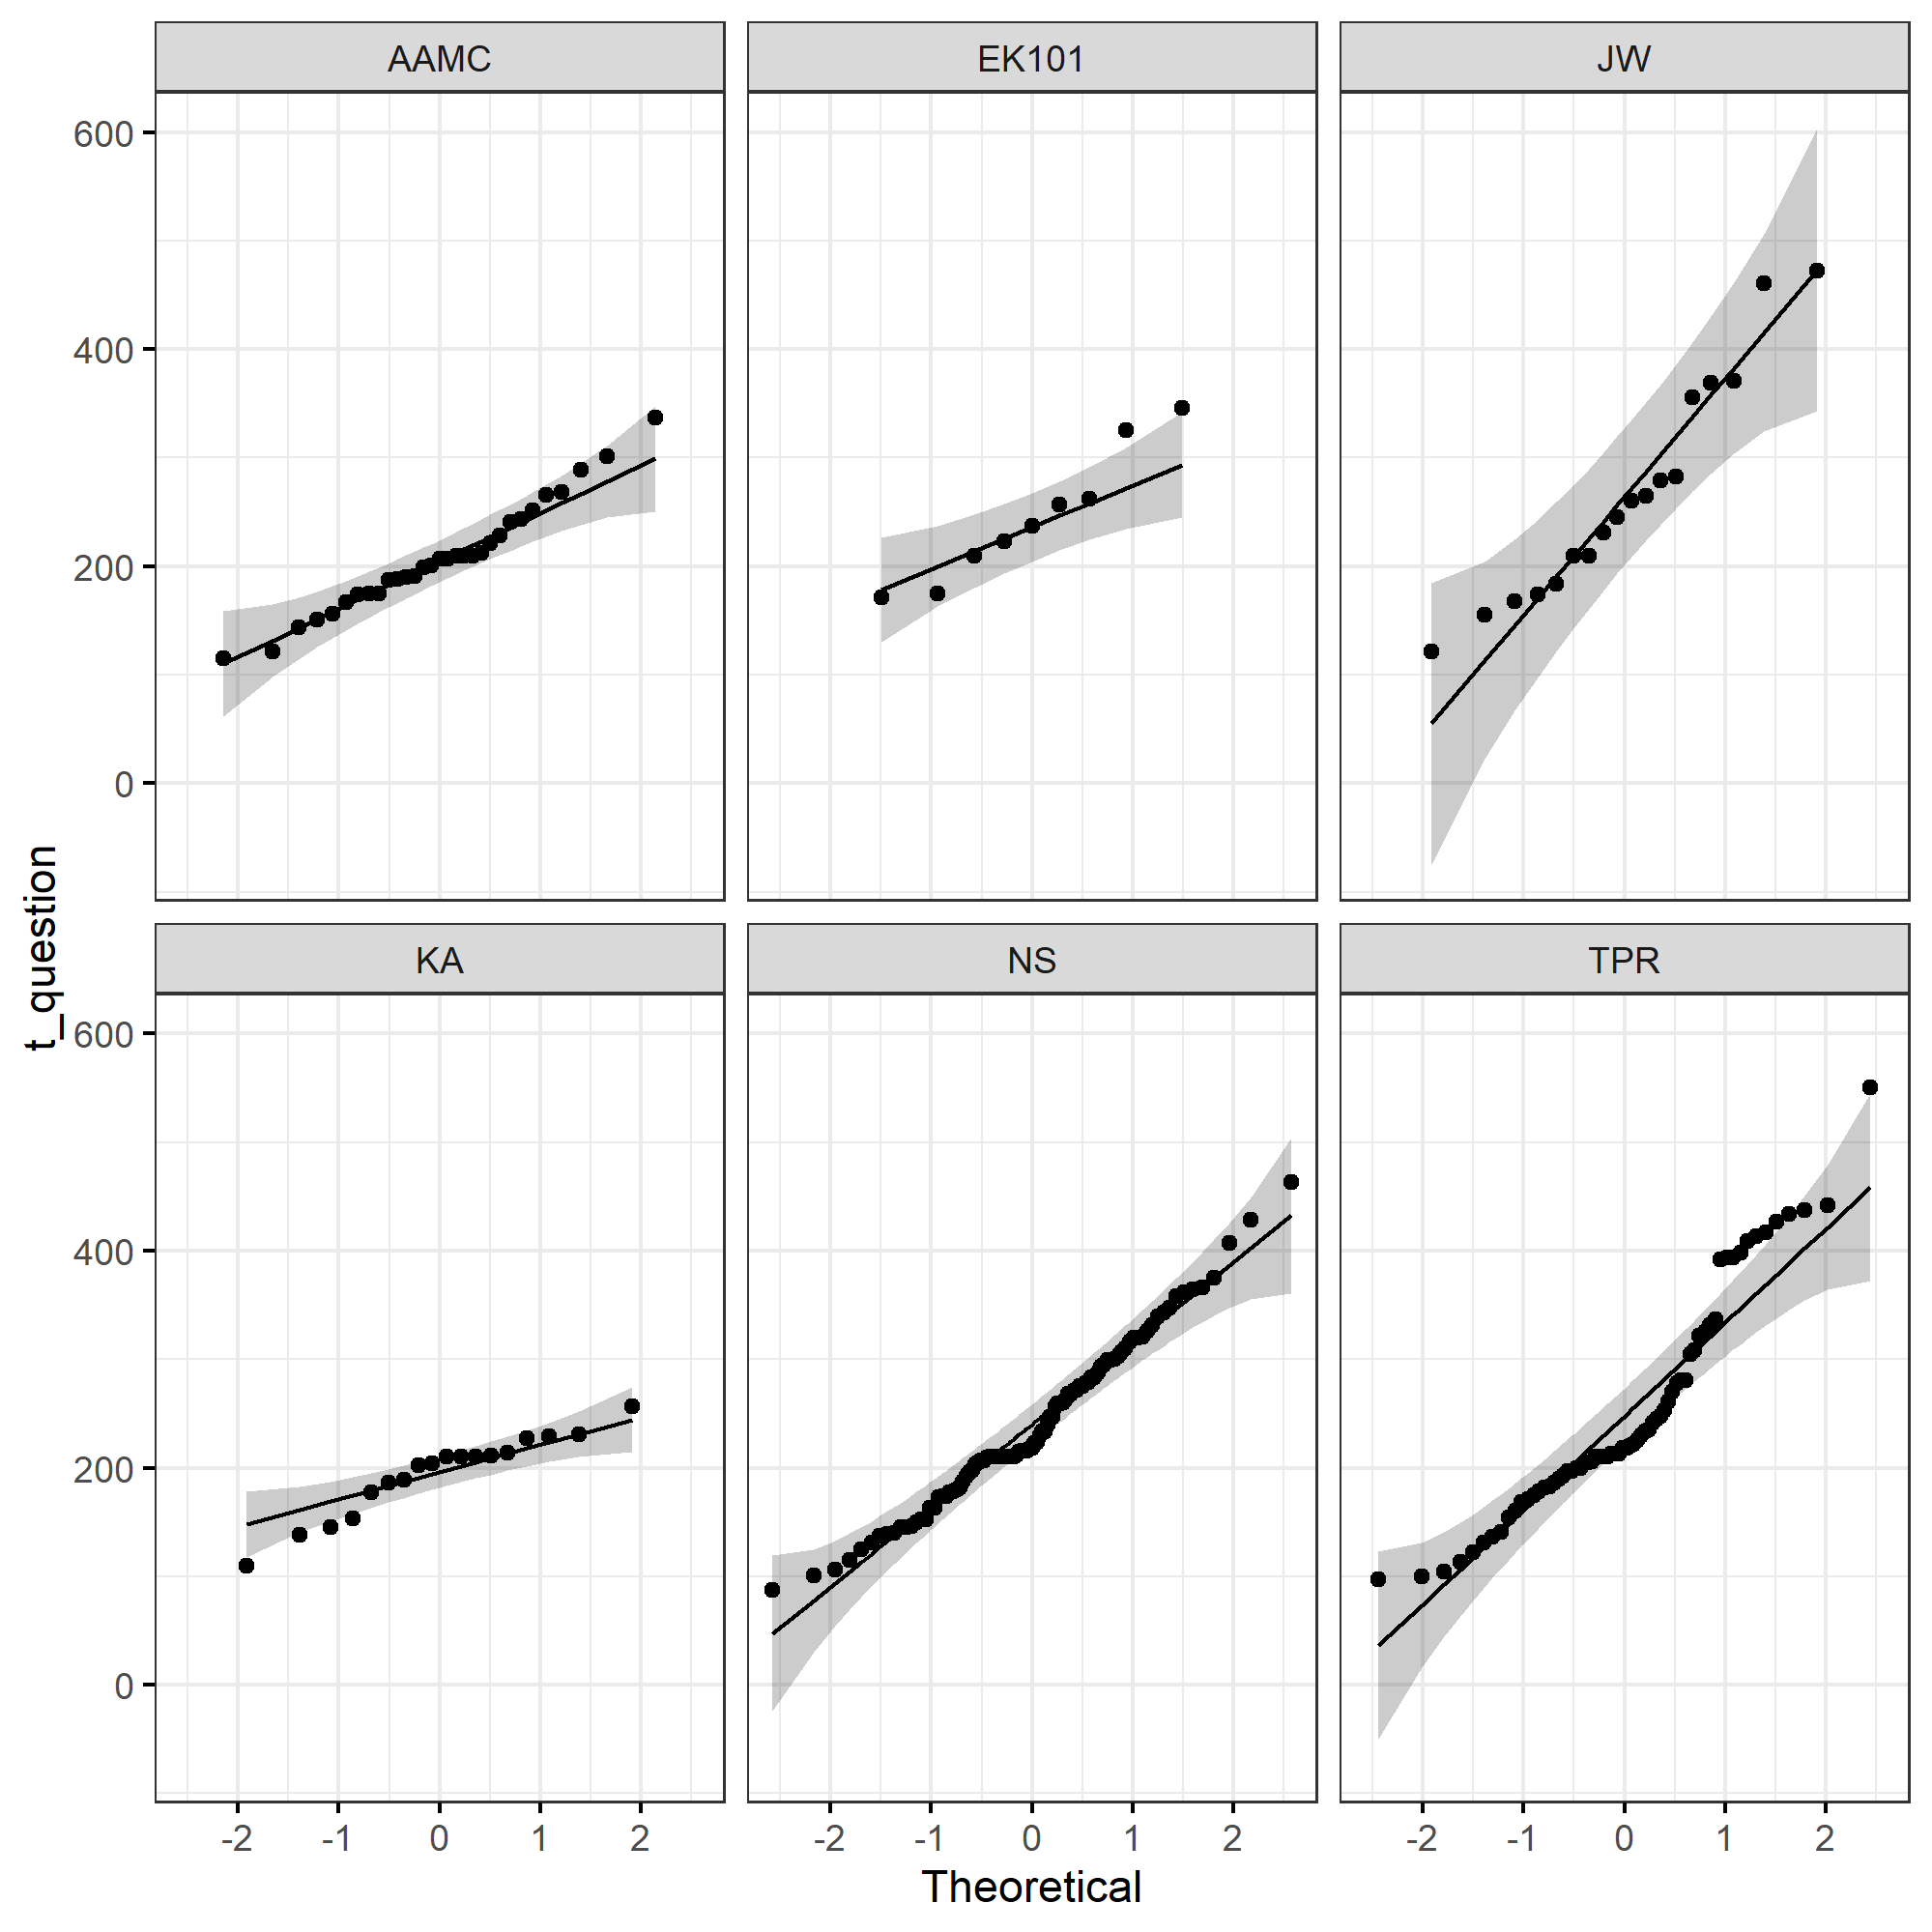
QQ plots for question times.
Although some companies' data look close to normal (particularly NS'), others are clearly not normal (e.g. TPR, JW).
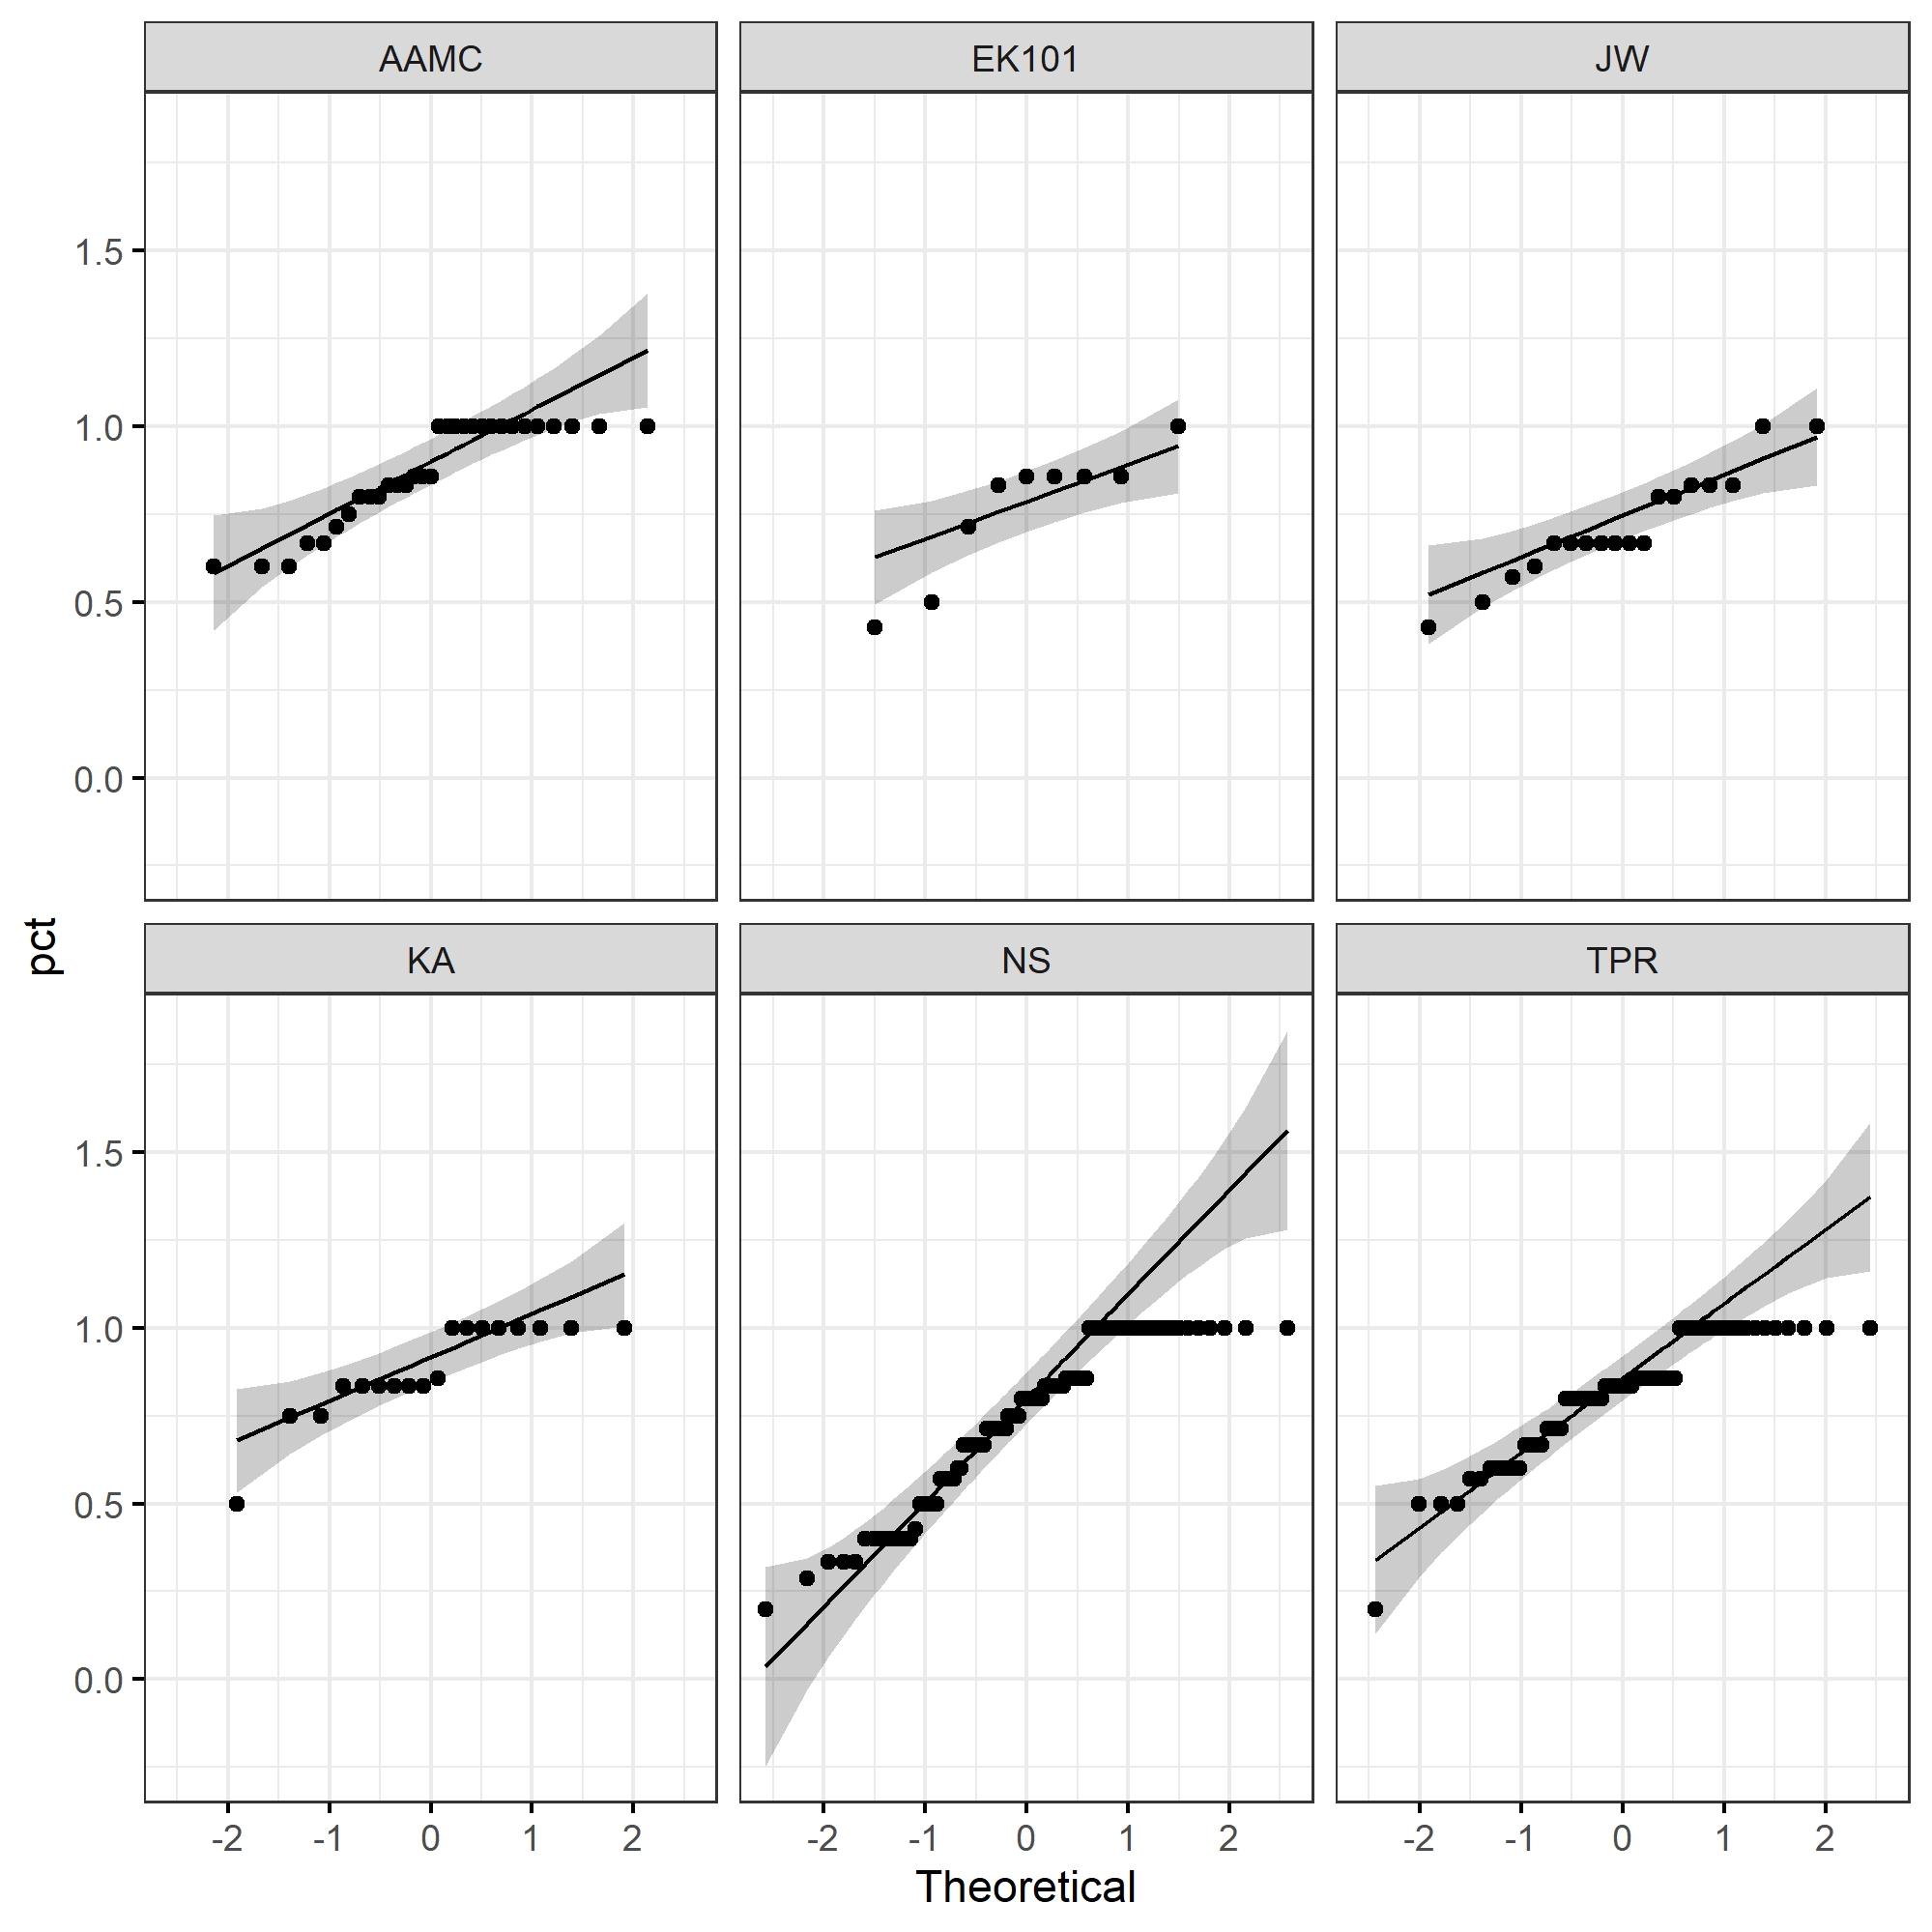
QQ plots for percent scores.
Note that, since percents are constrained in $[0,1]$, we do not expect that these will be normally distributed at all. #### Results of MANOVA. MANOVA with Pillai's test statistic gave a p-value of 6.279e-06, so I next conducted pair-wise comparisons with Games-Howell's test, which was chosen because it is non-parametric and thus suitable for data that are not normally distributed. In terms of timing, only NS differed significantly from AAMC, and only in reading time (Figure 7). This is somewhat surprising because, from the boxplots, it appears as if the different companies' question times are distributed quite differently from one another. Yet, for question times, KA:NS and NS:TPR are the only statistically significant combinations. Moreover, only the scores of JW and NS differed significantly from those of AAMC (both were lower; Figure 8). Some of these 'surprising' results may be attributed to the low sample size for certain companies. For instance, I only did 9 EK101 passages and 18 JW passages. In comparison, I did 90+ NS passages and 50 or so TPR passages. For a more accurate comparison, it would be helpful to collect more data from each of the companies.
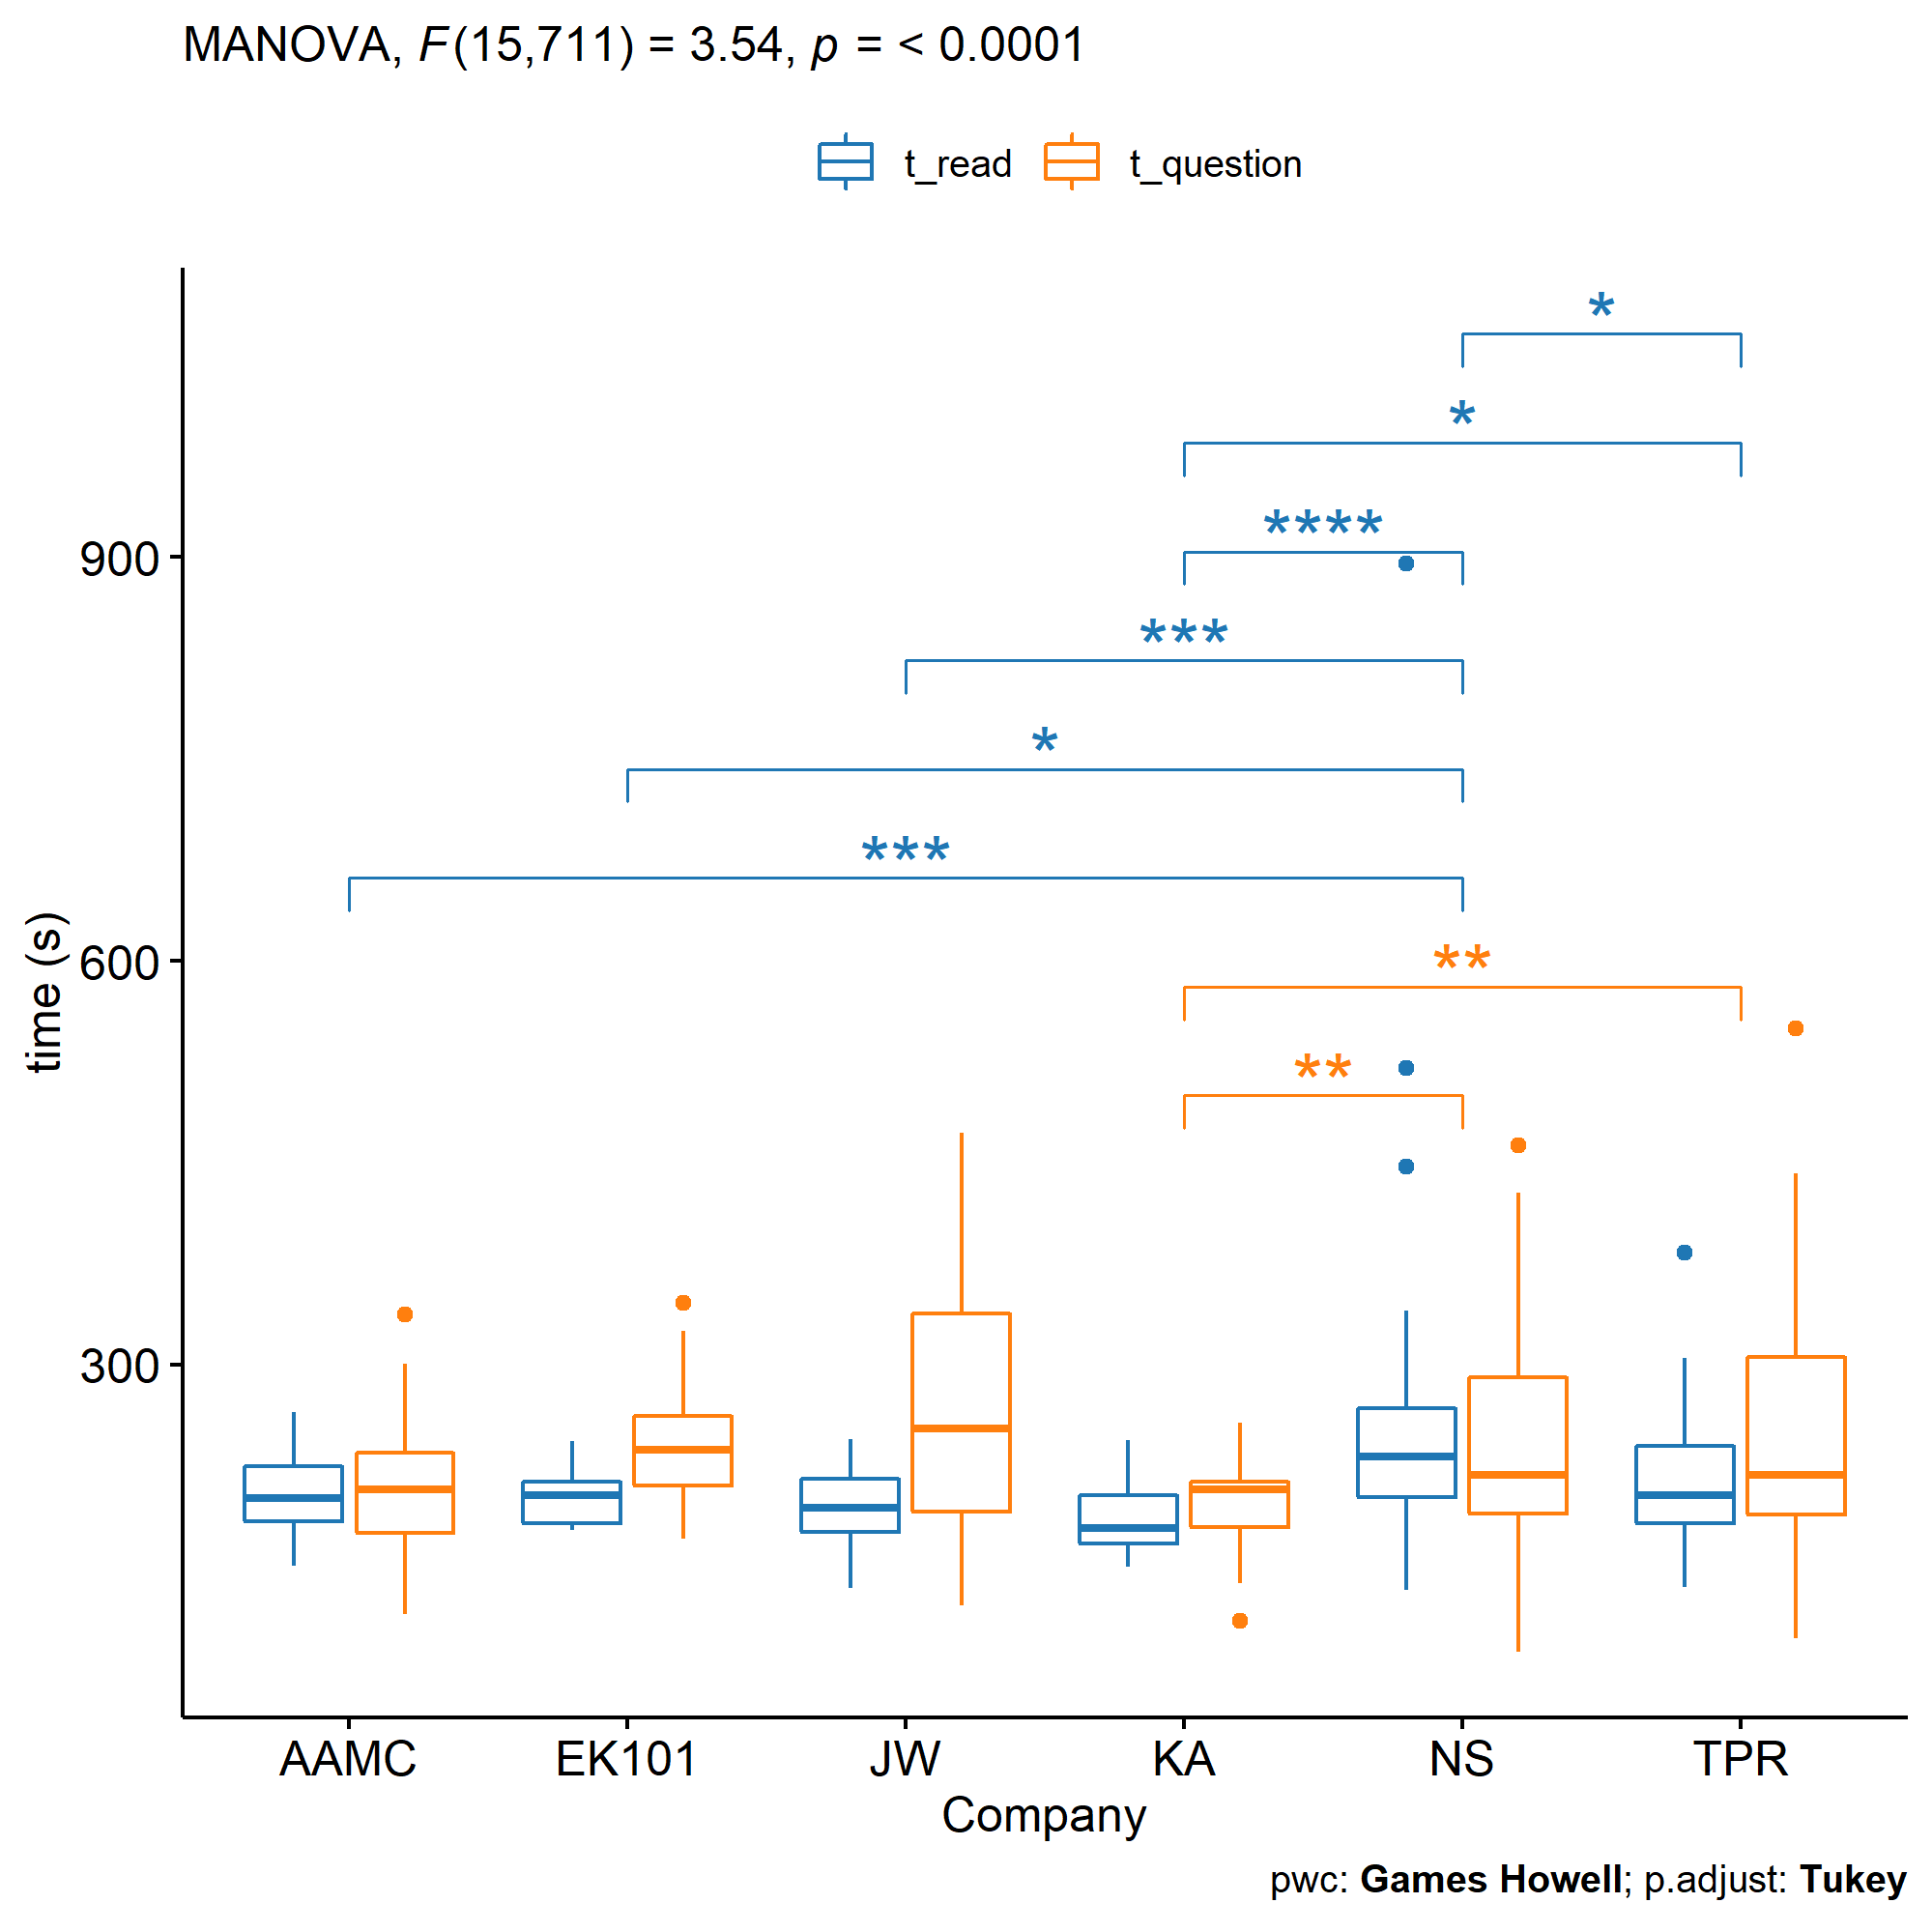
MANOVA for reading and question times.
Box plots for reading time (blue) and question time (yellow). *Circles indicate outliers. Boxplots extend from the first to third quartiles for each company's data.*
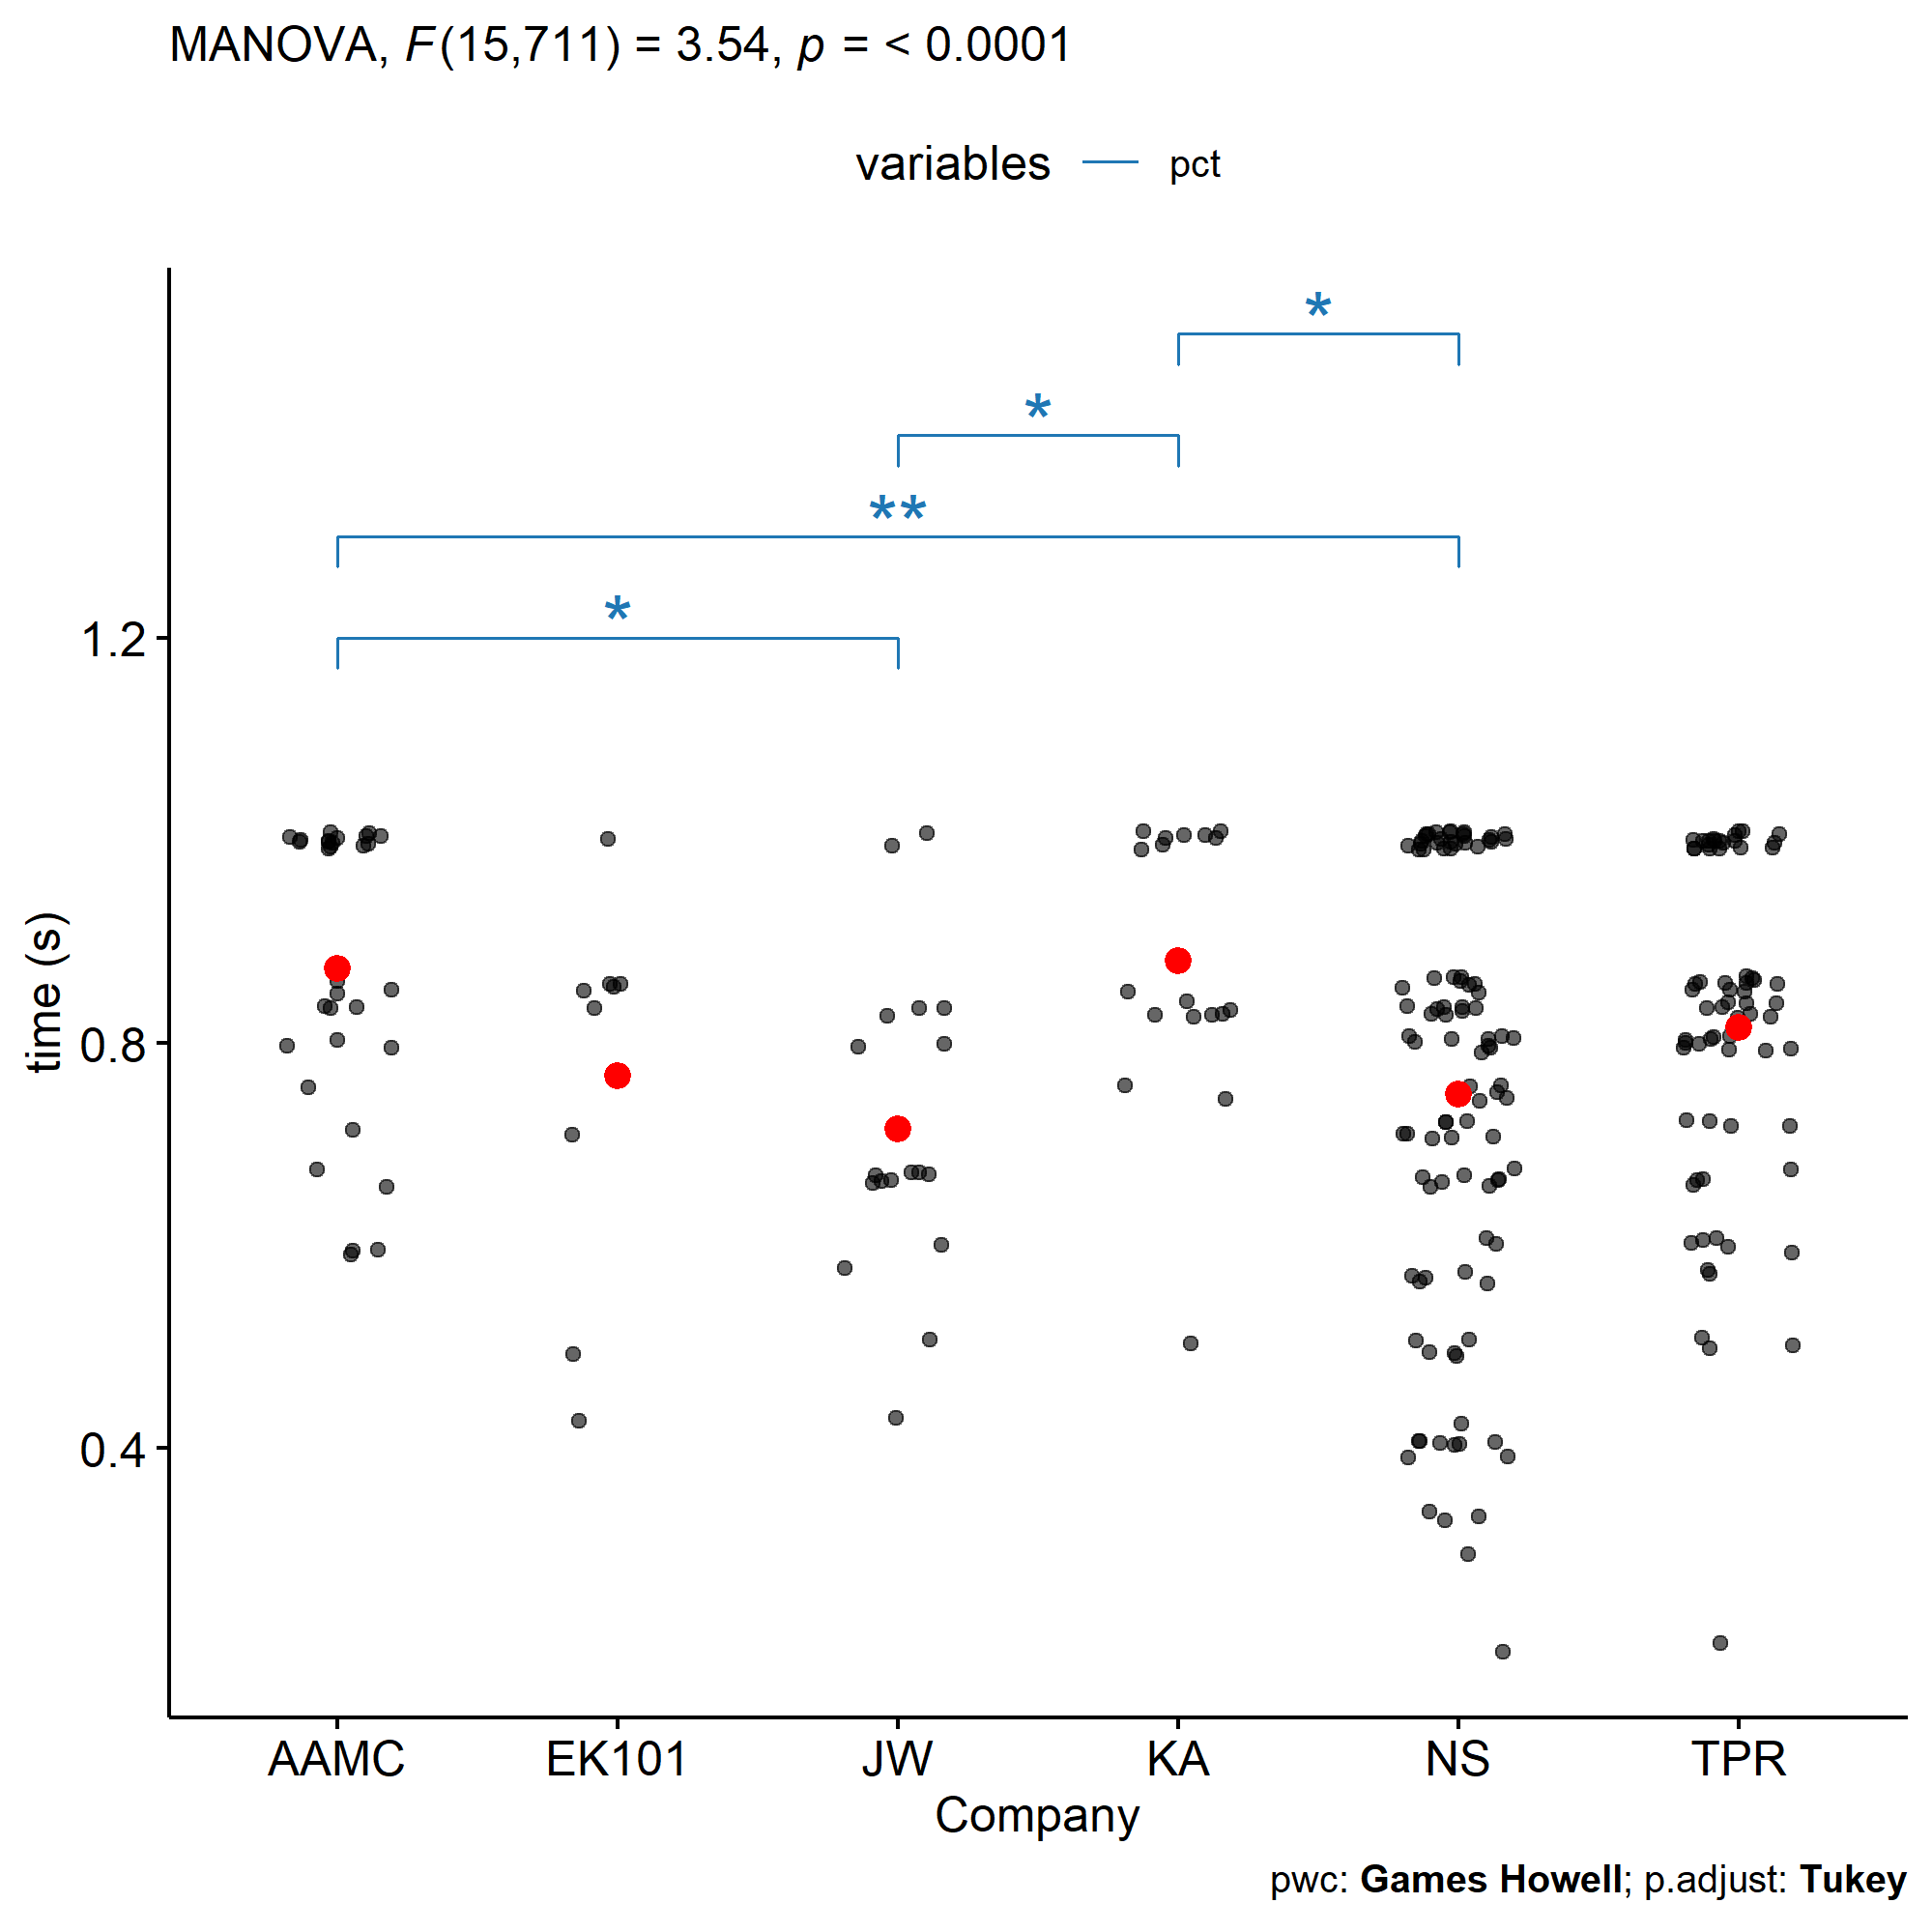
MANOVA for percent scores.
*Black circles indicate scores of individual passages. Red circles indicate the mean score for each company.* |variables |Company1 | Company2 | p.adj| |:----------|:------|:------|--------:| |pct |AAMC |JW | 1.30e-02| |pct |AAMC |NS | 6.00e-03| |pct |JW |KA | 1.70e-02| |pct |KA |NS | 1.80e-02| |t_question |KA |NS | 5.00e-03| |t_question |KA |TPR | 6.00e-03| |t_read |AAMC |NS | 1.00e-03| |t_read |EK101 |NS | 1.50e-02| |t_read |JW |NS | 2.02e-04| |t_read |KA |NS | 4.90e-06| |t_read |KA |TPR | 2.40e-02| |t_read |NS |TPR | 1.80e-02| **Table 1. Pairwise comparisons using Games-Howell's test.** ## Final week of studying data and analysis. Roughly one week before my exam, I began scheduling and recording my study sessions using [PomodoroLogger](https://github.com/zxch3n/PomodoroLogger). In addition, I kept adding daily updates to [Daylio](https://daylio.net/), an iPhone app that I use to track my mood and completion of various activities and daily goals. Besides CARS, I spent the first few weeks of my studying heavily focused on psychology and sociology, mainly via [Anki](https://apps.ankiweb.net/) (which I ultimately spent a total of 1.52 days in). Afterwards, I shifted my focus to physiology and biochemistry. The latter took up most of my final week of studying.
How I spent my final week of studying.
* (A) Time spent (in hours) in Pomodoro sessions ("active", green bars) versus sleeping (blue bars). Red lines and circles show, for each day, the time spent in Pomodoro sessions, as a fraction of the total time remaining in a day after subtracting time spent sleeping. * (B) Study sessions each day, colourized by categories indicate in the legend (upper right). Labelled arrows in each day indicate time spent asleep. * (C) Histogram showing the number of Pomodoro sessions in each hour of day throughout the week. * (D) Heatmap showing the presence or absence of certain activities. For columns labelled with weekdays, the absence of an event is indicated by a white cell, whereas a black cell indicates that an activity was done that day. Cells in the penultimate column are labelled with the percent of the days in the current week where an activity was completed. The column 'All' indicates the total frequency of completion for each activity, as a percentage of days from when I began using Daylio, up until the last day of studying. I believe that the data in Figure 9 are generally an underestimation of the actual time I spent studying, as I often forgot to restart my Pomodoro sessions after a break, or continued working after a session had ended. For example, on August 12th, the day before my exam, I did my first and only practice full-length exam (the AAMC Sample exam). I probably took about 8 hours, but only logged about half this time (as "N/A" sessions). Nonetheless, I think that this data captures my daily schedule quite well: I usually woke up sometime between 10 AM and 1 PM, and rarely started studying before 1 PM. Most of my studying was done in one of two time windows: 2-8 PM and 10 PM - 3 AM. On average, I studied 5.1 hours a day and slept 11.5 hours a day. Note, however, that the time I spent 'sleeping' was simply calculated as the longest time interval in a day that did not have a Pomodoro session. For example, if I woke up and did not study, but did something else for a couple hours, this additional time is also considered time spent sleeping. How efficient was I, time-wise? One way to be 'efficient' would be to have simply spent all my waking hours in Pomodoro sessions. In reality, I spent somewhere around 30-50% of my time awake in Pomodoro sessions (Figure 9A). Interestingly, the fraction of my waking hours that I spent studying peaked around 50% on Monday and slowly decreased in an oscillating manner over the week. At this point, I had been studying fairly hard everyday for a couple weeks, so I was probably quite tired, but it's unclear whether this has anything to do with the oscillating pattern. ## Takeaways. First, I think that practicing CARS helped me both materially and psychologically. As each section of the MCAT has passage-based questions and incentivizes strong reasoning ability, practicing CARS may improve performance in the other sections, too. Furthermore, simply doing a nine (or more) passages everyday, regardless of score or timing, probably helped me build stamina for the real exam, especially since I only did one full-length practice exam. My initial emphasis on practicing CARS was motivated by past difficulties in the section. In fact, there were some days where the only studying I did was my daily CARS practice. However, progress in CARS can be slow, difficult, and non-linear (Figure 1). Even I had weeks where my score and/or timing worsened considerably. Though, non-linear progress, plateaus, and fatigue are probably inevitable when compressing MCAT preparation into a short timeframe. Developing effective ways to work around these obstacles is paramount to sustaining motivation and general well-being. Looking back, I would have preferred to follow a more structured approach to studying the scientific material, e.g. [Integrated MCAT](https://integrated-mcat.com/). In 2018, when I eventually scored a 526, I religiously followed the advice of [r/mcat](https://www.reddit.com/r/Mcat/): I used UWorld, did one full-length exam each week (including all of the AAMC exams), and completed all of the other AAMC materials - multiple times, even, for some of them. This time, of course, I only purchased one AAMC resource (CARS QP2) and only did one full-length practice exam on the day before my exam. Thus, I now think that reasoning is very important in the MCAT, and not easily obtained through practice. By the way, this is my first post here in almost a year.. That's insane. Coincidentally, I've been a NEET for nearly just as long. Wow. Hopefully, if/when I update this blog again, I'll no longer be a NEET.